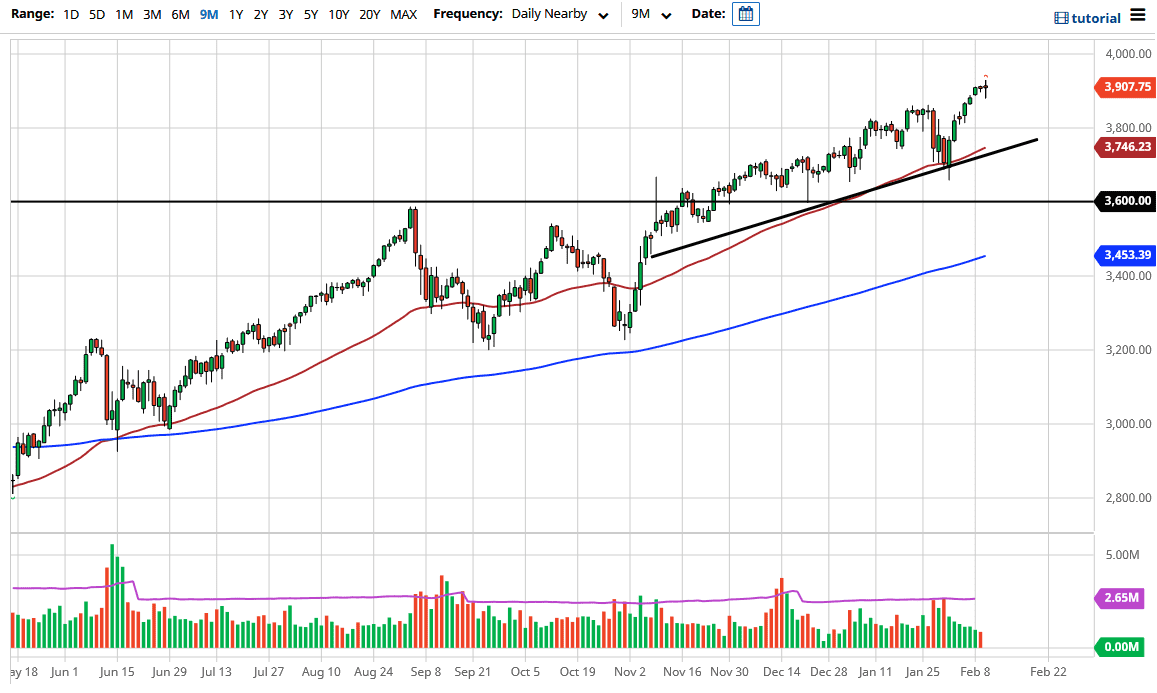
The S&P 500 fluctuated during the course of the trading session on Wednesday as we continue to dance around the 3900 level. This is an area that attracts a certain amount of attention due to the fact that it is a large, round, psychologically significant figure, but at the end of the day it is yet another handle that we are simply acknowledging.
When you look at the chart, you can see that we are clearly in an uptrend with a nice uptrend line underneath that is also supported by the 50-day EMA, so it is likely that the trend is massive in its resilience, and there is no reason to think that we are going to break down below those levels. However, if we were to do that, it is likely that I would be buying puts just with the possibility of making a little bit of a profit.
I do believe that longer term, based upon the consolidation area underneath from which we have broken out, it looks like we are going to go to the 4000 handle. Remember, we had been bouncing between the 3200 level on the bottom and the 3600 level on the top. That is 400-points, and a simple measured move from the 3600 level opens up the possibility for a move to the 4000 handle. Beyond that, the 4000 handle will attract a lot of attention and traders will be looking to get there. I think that it will be difficult to break above that level, at least in the beginning, as the market is going to see a lot of traders out there willing to take profit.
Looking at the candlestick, we can go in any direction; but we are a little bit over-extended, so it does make sense that we would see a very rough couple of days going into the weekend. When I say rough, I mean simple choppy behavior. There are plenty of buyers waiting to get involved, so any drop in price is probably going to be thought of as an opportunity, not something concerning in a market that has clearly been in an uptrend for several months now.

