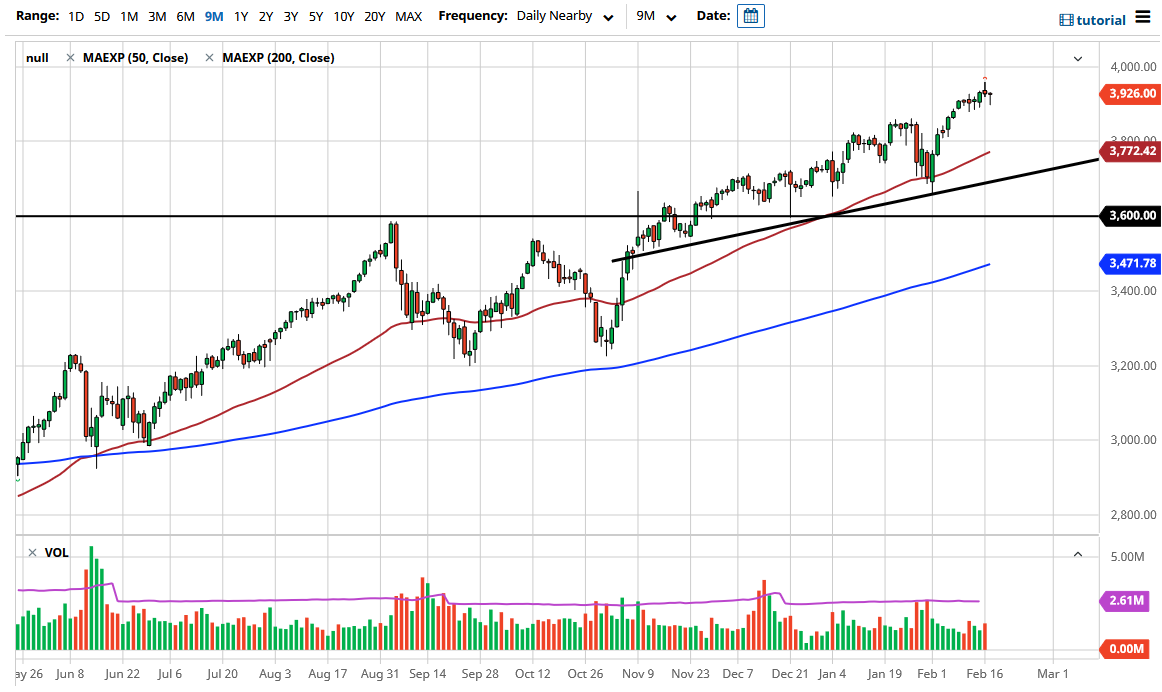
The S&P 500 initially fell during the trading session on Wednesday, but as we have seen time and time again, the buyers have come in late in the day to push things back up. The resulting candlestick was a hammer, which flies in the face of the shooting star from the previous session. I think we are going to eventually break above the highs of the previous session and go looking towards the 4000 handle. That is a large, round, psychologically significant figure that will attract a certain amount of attention. I think just the headline noise itself will probably have people taking profit once we get there. I know 4000 seems like an extraordinarily high number, but it is just 75 points from where we are right now. In other words, we could very well get there by the end of the week.
On the other hand, if we were to break down below the 3900 level, then it is likely that we could go down to the 3850 handle, possibly even down to the 3800 level after that. The 3800 level underneath will attract a certain amount of attention not only due to the fact that it is an area where we had seen a lot of trading previously, but more importantly I think that the 50-day EMA racing towards that area will attract a certain amount of attention as well. Nonetheless, I think that dips will continue to be bought into, assuming that we can even get one. It is obvious that the market has gone way out of its way in order to find reasons to go higher, and even with the interest rates rising in the 10 year note, we have seen the market push back against that, so I think that the move to the 4000 level is all but a given at this point.
The previous consolidation between the 3200 level and the 3600 level is the part of the market that I measured the breakout from, and it is clear that we have done everything we can to get up to that measured move, and I think that most other technicians around the world see the same potential move. As long as this is the case, I think that you can only remain “long only” more than anything else.