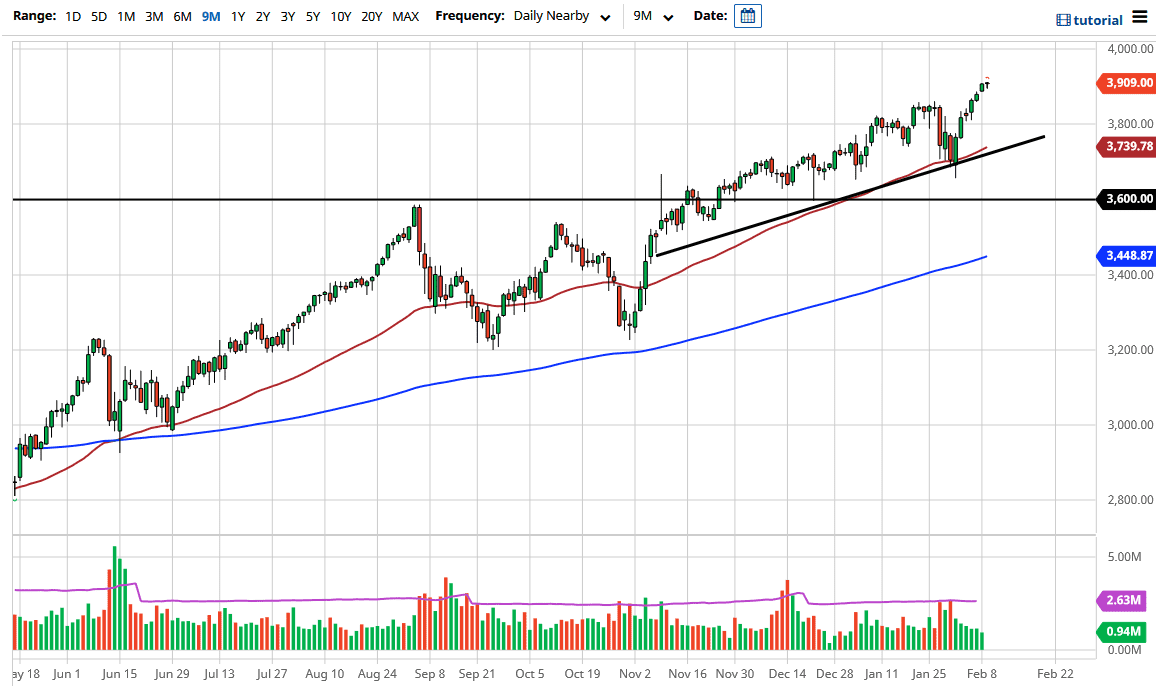
The S&P 500 pulled back just a bit during the trading session on Tuesday but continues to find buyers on dips. We are getting a bit stretched, and I think it is only a matter of time before we get a reasonable pullback. That pullback should be a nice buying opportunity to pick up value, because it is almost impossible to short a market that is driven by liquidity only. Granted, it is the midst of earnings season, but I do not know that it matters. After all, this has happened time and time again: every time the market pulls back, the buyers come back in to pick up value.
I do think that we will continue to go much higher and go looking towards the 4000 level. The 4000 level is a large, round, psychologically significant figure, and I believe this market will not only reach that level but break above it. When we first initially get there, it is very likely that this market will be pushed back down, but I think given enough time they will eventually find some type of narrative to break it out.
You truly need to look for some type of value. Remember, the S&P 500 is essentially driven by the same seven stocks that it has been over the last couple of years, with a whole host of other stocks simply offering a little bit of filler. The markets continue to move based upon the idea of stimulus, and the biggest concern out there is going to be if stimulus for some reason is either smaller than anticipated or does not come through. If that is the case, then we could see a rather strong correction, but look at that correction as a buying opportunity, because the Federal Reserve or somebody else will step in to pick it up. You should pay attention to the fact that the 50-day EMA and the uptrend line underneath should continue to offer plenty of support, as well as the 3800 level. We will see plenty of areas underneath that will attract a certain amount of attention, so I think it is simply a matter of waiting for a better spot to get involved. I would not be “paying up” at this level.