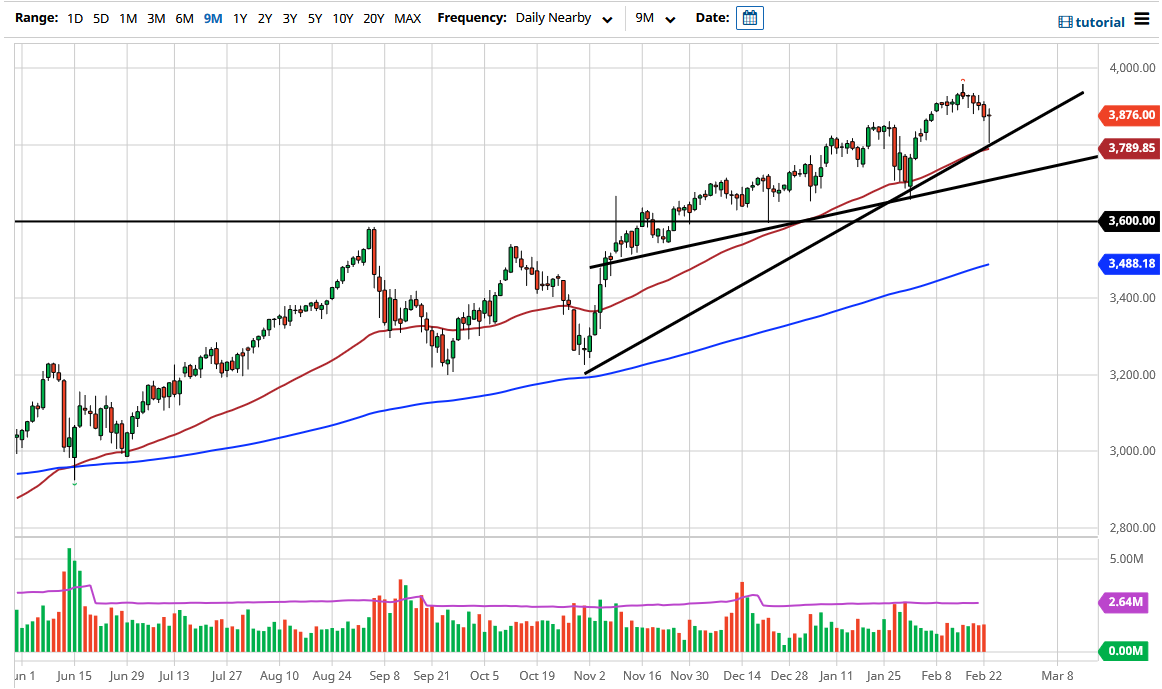
The S&P 500 fell rather hard to kick off the trading session on Tuesday, as traders started to worry about the congressional testimony by Jerome Powell later in the day. He fell right in line with his private equity roots, protecting any idea of Wall Street losing money. The most notable statement was that the “bottom quartile of the United States is currently experiencing 25% unemployment.” He stated that the Federal Reserve was nowhere near the idea of tightening rates or monetary policy, and it is probably safe to say that we are at least 18 months away, if not multiple years. This is music to Wall Street's ears, as they buy risk assets.
We did bounce from a major uptrend line that just formed during the day, but more importantly, we bounced from the 50-day EMA. It is a major uptrend line, and the fact that we formed a major hammer suggests that we could go to the upside again. The 4000 level above would be a target, and it is based upon the previous consolidation that we have seen between the 3600 level and the 3200 level. By extrapolating the “measured move”, it suggests that we could go looking towards the 4000 handle.
On the other hand, if we were to break down below the hammer, the 50-day EMA, and the uptrend line, we then probably will go looking towards the previous uptrend line, so I think the downside is somewhat limited. However, if we were to break down below the second uptrend line, then I would start to buy puts in SPY instead of shorting the index, because it is far too dangerous to do that. Nonetheless, this is a market that thrives on cheap money, and has been doing so for 13 years. I do not see that changing in the short term, so I like the idea of pressing the issue and continue to be a buyer. Now that Jerome Powell is out of the way, the rest of the week can focus on the 10-year note and interest rates. As long as they do not spike too much, that should continue to keep a situation where the market is probably going to continue to go higher.

