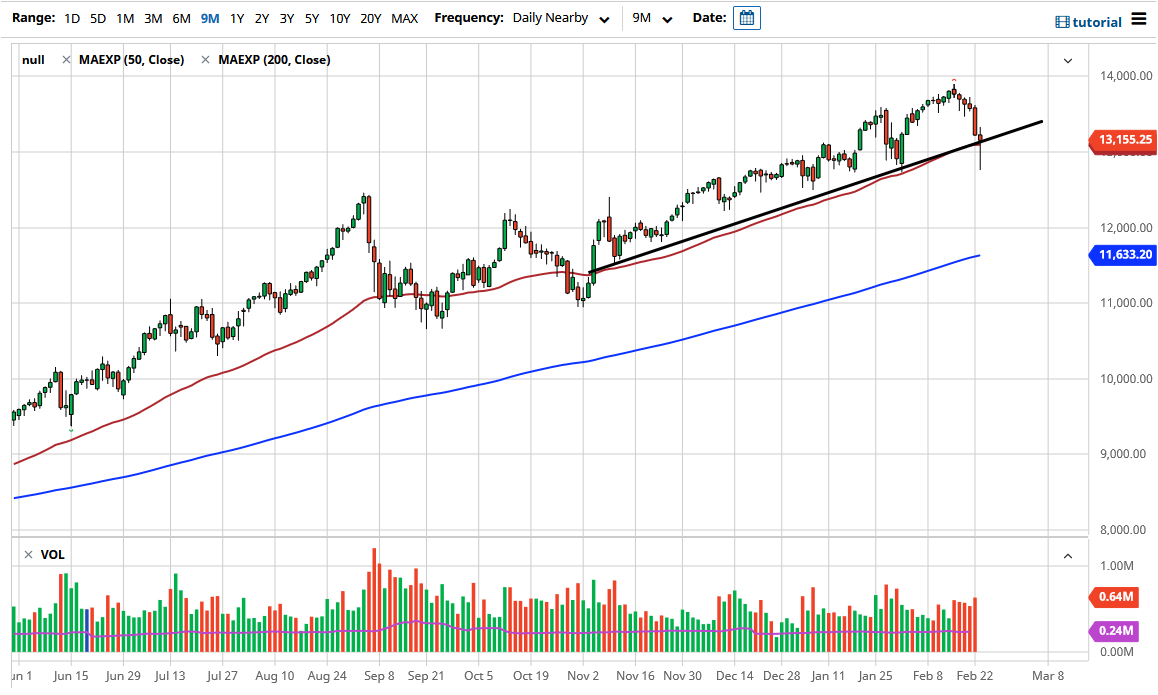
The NASDAQ 100 fell rather hard during the trading session on Tuesday as the world awaited the congressional testimony of Jerome Powell. Once it became abundantly clear that he was going to do what he could to keep the markets levitated yet again, Wall Street piled money into the stock market in the same manner that they have for the last 13 years or so. This is a market that is paying attention to interest rates and whether or not the Federal Reserve is going to flood the markets with money.
The shape of the hammer is a bullish sign, but the fact that we held onto the uptrend line and the 50-day EMA is what really catches my eye. If we can break above the top of the candlestick, then the market is likely to go looking towards the 13,500 level, and then eventually the 14,000 level which has been my target for a while. Beyond that, we could even go as high as the 15,000 level, but what I like the most about all of this is that we are moving in a very steady channel, which is something that is much more sustainable than the parabolic spike we have seen in some other markets.
If we were to break down below the bottom of the candlestick, that would be a very negative turn of events, probably allowing the market to drop to the 12,500 level, and then eventually the 12,000 level where we would meet up with the 200-day EMA. In general, this is a market that is just like the S&P 500, in the sense that I would not be a seller, but if we break down below the bottom of the hammer, then I would buy puts in the QQQ or some other type of ETF that could give me exposure to the downside without risking massive amounts of cash and a potential unlimited loss. All it would take is the right comment for somebody to turn around and shock this market to the upside, so I am very selective about doing anything remotely close to shorting the stock market in America. Yes, I know that we are in a bubble, but then again, so is everybody else. With that in mind, this is the game we are playing.

