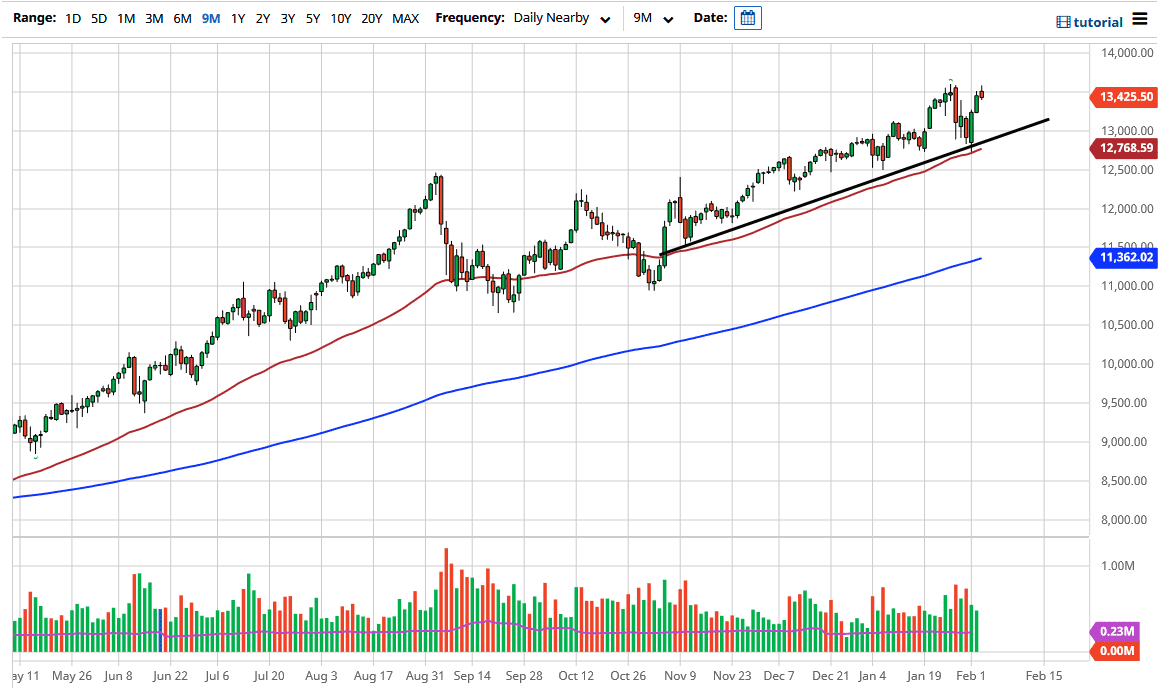
The NASDAQ 100 hit the all-time high again during the trading session on Wednesday but gave back the gains to drift lower by the end of the day. This is not to say that we are breaking down, just that we are probably going to need some type of catalyst to break to the upside. The market will probably churn a bit, as we have the jobs number coming out on Friday, and a lot of people will be cautious about throwing a ton of money into a market that has such a major influential announcement coming.
The candlestick for the trading session is somewhat like a shooting star and suggests that we will get a pullback. This is not a selling opportunity, though, and I think it will offer a bit of value underneath. The 13,000 level is also underneath that could offer a bit of support, and if we were to fall that far, I think that a lot of value hunters will jump back in. On the other hand, if we could break above the top of the candlestick for the trading session on Wednesday, that would be a very good sign as well, and it could open up a possibility for a move to the 14,000 level after that. For the longer term, I believe that I am looking for the 15,000 level over the next couple of months. I believe that we will continue to go back and forth and then push to the upside.
If we were going to break down below the 50-day EMA, then it would be a significant breach of support, opening up the move down to the 12,000 handle underneath. Somewhere in that area I would anticipate that there would be even more pressure to the upside, but regardless of what happens next, I am not going to be a seller. Look for bits and pieces of value and take advantage of them, because that is what most people are doing as we continue to see more of the same behavior that we have seen over the last 12 or even 13 years now. Liquidity continues to push stocks higher.