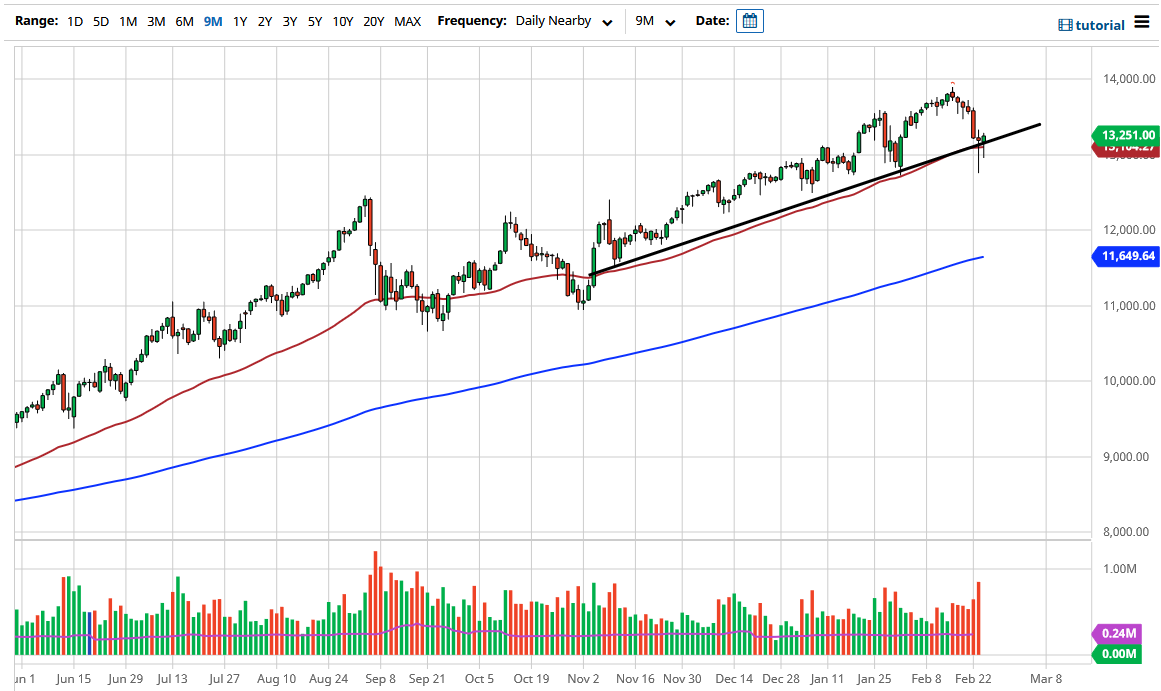
The NASDAQ 100 has broken down below an uptrend line during the trading session on Wednesday again, just as we did during the day on Tuesday. The market reached towards the 13,000 level where buyers came in to step up and pick the market up as well, as the 50-day EMA is slicing through the daily candlestick. The candlestick is very supportive, especially considering that the previous candlestick was also a hammer.
If we were to break above the top of the hammer for the trading session on Tuesday, then that opens up the markets for a bigger move towards the 13,500 level. After that, then we could go looking towards the 14,000 handle. This is a market that I think continues to be very noisy, mainly due to the fact that although tech has been a favorite for quite some time, the reality is that markets are starting to fade into the “value trade”, which a lot of the tech stocks simply are not part of, as they have been rallying for a while. We have two hammers, the 13,000 level, an uptrend line, and then the 50-day EMA, all winding up to show signs of support.
Regardless, shorting the NASDAQ 100 is a great way to lose money, just as we have seen in the S&P 500. If we break down below these hammers, I would be buying puts against the index or an ETF that represents the index. I would not actually short the NASDAQ 100 itself, because this is a market that has been on a mission to go not only to the 14,000 level, but I think eventually the 15,000 level.
The NASDAQ 100 is highly influenced by a handful of stocks that everybody seems to love, so it is almost unimaginable that we would fall apart for any significant amount of time, and I do think that the value hunters will continue to jump in and pick this market up every time it drops. The volatility could pick up a bit, but at the end of the day this is a “one-way trade” that the markets continue to show. The most important thing on the candlestick from the session on Wednesday is that the bottom of the candlestick did not break down below the bottom of the previous one. This shows tenacity.

