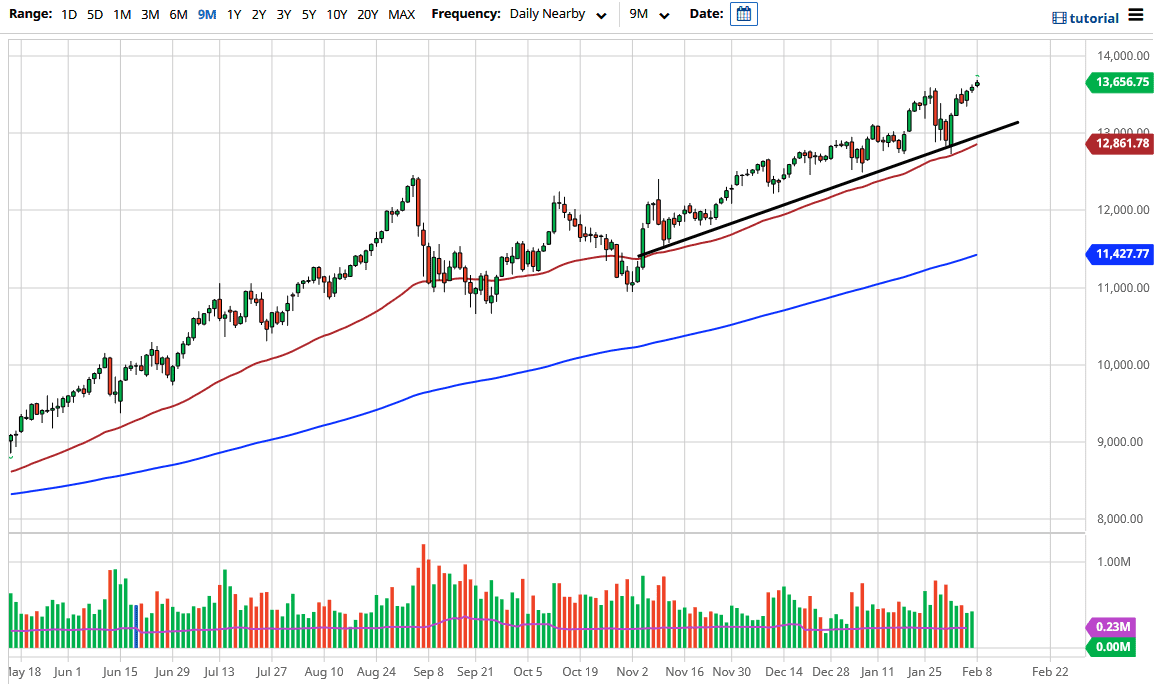
The NASDAQ 100 rallied again during the trading session on Friday as it typically does. After all, this is based upon the handful of major companies that are pushing the narrative of the “work from home trade”, and the growth in the technology sector. We are at all-time highs, which suggests that the market is probably going to go looking towards the 14,000 level. Furthermore, we have recently bounced from an uptrend line and the 50-day EMA, so it suggests to me that we are going to continue going higher. The 13,000 level offers a certain amount of support, so I think that we will continue to find buyers every time we get some type of reprieve.
You cannot short this market, just like you cannot short any of the major indices in the United States, due to the fact that they are heavily manipulated by the Federal Reserve, trading houses, and a massive amount of liquidity overall. The fact that the last couple of candlesticks have been much smaller than the previous ones tells me that the market is probably running out of momentum a little bit here, but that does not necessarily mean that the market is going to turn around and collapse. If you are patient enough, you should get a day or two of negativity in order to find some type of value that you can take advantage of, as this has been a long-term running uptrend.
Even if we did break down below the uptrend line in the 50-day EMA, the market is likely to go looking towards the 12,000 handle, which by the time we get down there, I would anticipate that the 200-day EMA is going to be nearby as well, which will attract a lot of headline attention. In general, I believe that we will continue to find plenty of buyers on dips and go looking towards 14,000 above, and then possibly looking further to go towards the 15,000 level above. This is a market that continues to be crazy, but it is most decidedly bullish, and there is no way to fight that as we have seen so much in the way of momentum every time it looks like we are in trouble.