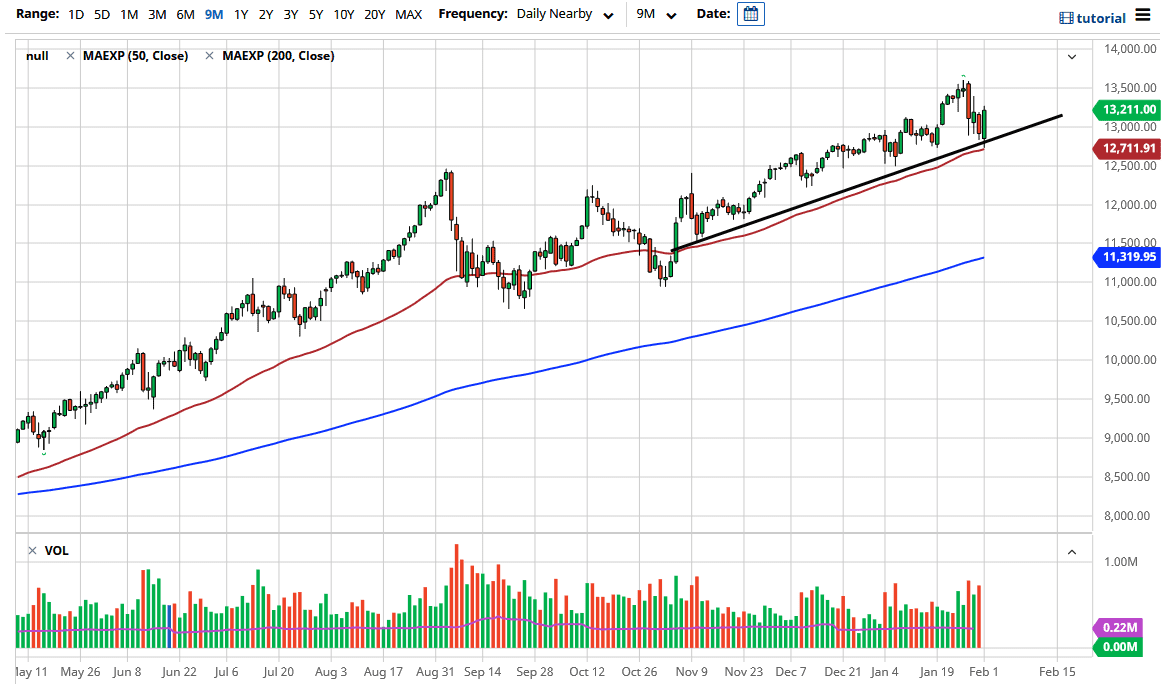
The NASDAQ 100 bounced from the 50-day EMA, showing signs of strength again and an outsized move to the upside. The market looks as if it is ready to continue going higher based upon the fact that we have formed an engulfing candlestick, and the fact that we are in an uptrend to begin with. After all, the NASDAQ 100 is a highly manipulated index and is not equally weighted, so it is one that you can only buy or be on the sidelines.
We are in the midst of earnings season, so that can have a certain amount of influence on markets and on risk appetite in general. At this point, you will probably see buyers coming in to take advantage of any type of dip that appears, because the NASDAQ 100 is one of the first places people go looking to get involved in pick up a bit of alpha. The 50-day EMA underneath being broken to the downside could open up a move to the 12,000 level, but I think it is very unlikely to happen anytime soon. If we did break down below the 12,000 level, though, then we could make a serious attack on the 200-day EMA.
It is much more likely that we will go looking towards the 14,000 level than the 12,000 level, and after the move that we have seen during the trading session on Monday, I think that is an easier call to make today than it was previously. Nonetheless, there is absolutely no reason to be shorting this market anytime soon so I will simply wait for short-term pullbacks to show signs of support that I can take advantage of due to the overall nature of the trend. No matter what happens, there is always a narrative that Wall Street finds reason enough to get long over. I do not necessarily think that we will go straight up in the air, so you need to be cautious about when you jump in and maybe build up a position over the longer term more than anything else. You will notice how the 50-day EMA has been almost perfect to show signs of support, just as the uptrend line has.

