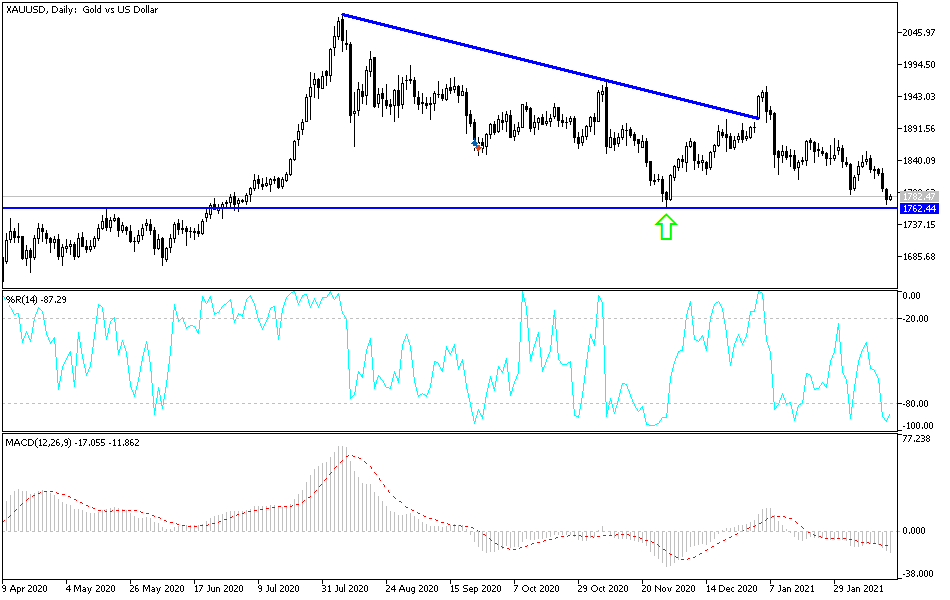
For five consecutive trading sessions, gold has been sold off, having plunged below the $1800 support level yesterday before settling around the $1777 level at the beginning of Thursday's session. The recovery of the US currency and the rise in global bond yields were the most prominent factors that contributed to the recent selling of the metal. After the sell-offs and technical indicators starting to turn into oversold areas, gold investors are waiting for the stronger opportunity to return to buy gold.
The US Dollar Index rose to 91.06 before settling steadily at 90.95. The yield on the US 10-year yield rose to more than 1.3%, hitting its highest level in nearly a year, driven by mounting inflationary concerns following the launch of vaccines and the prospects for further stimulus. In the same performance, silver futures for the month of March closed lower at $27,315, while copper futures for the month of March settled at $3.8205.
Data released by the Department of Commerce showed that US retail sales rebounded more than expected in January, rising by 5.3%, after falling by an adjusted 1% in December. Economists had expected retail sales to jump 1.1%, compared to the 0.7% decline originally announced from the previous month.
A separate report from the Labor Department showed that US producer prices jumped 1.3% in January after rising 0.3% in December. Economists had expected producer prices to rise by 0.4%. The Labor Department reported that the larger-than-expected increase in the Producer Price Index, which measures inflation pressures before it reaches consumers, was the largest one-month gain on records dating back to 2009. This followed a much milder inflation reading of 0.3% in December and 0.1% in November.
The increase reflected a 1.2% jump in healthcare services and a 5.1% rise in energy prices, the largest increase since the 9% increase in June. January's increase means wholesale prices have risen 1.7% in the past 12 months, the largest increase compared to a similar period on record. Core inflation, which does not include volatile energy and food, rose 1.2% in January, and 2% in the past twelve months.
Analysts, who had expected a much smaller 0.4% rise in January in wholesale prices, now believe that inflation is likely to pick up this year after more than a decade, well below the Fed's 2% target for annual price increases. Rising inflation would not be unwelcome, as it signals a full reopening of the economy and the return of strong consumer demand. But many believe that inflation will still linger.
Fed Chairman Jerome Powell has already said that he expects a temporary spike in US inflation in the coming months, but also indicated that the Fed will not allow them to preemptively increase federal interest rates. The Fed currently has its rate at a record low near zero, and is expected to keep interest rates low for the next three years to allow the economy to recover from the recession caused by the global pandemic.
According to a report by the Federal Reserve Board, industrial production in the US rose 0.9% in January after jumping by a downwardly revised 0.9% the previous month. Economists had expected industrial production to rise 0.5% in January.
Technical analysis of gold:
According to the performance on the daily chart, the bearish channel is getting stronger and the recent sell-offs touched the lower line of the channel, pushing the technical indicators to strong oversold areas, so I prefer to take advantage of the recent decline and start thinking about buying instead of more selling. The closest and most appropriate buying levels for gold will be $1769, $1755 and $1743. On the upside, the bulls will not have a chance to start controlling performance again without breaking through and settling above the $1800 resistance.
The price of gold will be affected today by the performance of the US dollar and the extent of investor risk appetite, in addition to the market's reaction to the announcement of the reading of the Philadelphia Industrial Index, the number of weekly jobless claims, then building permits and the housing starts.

