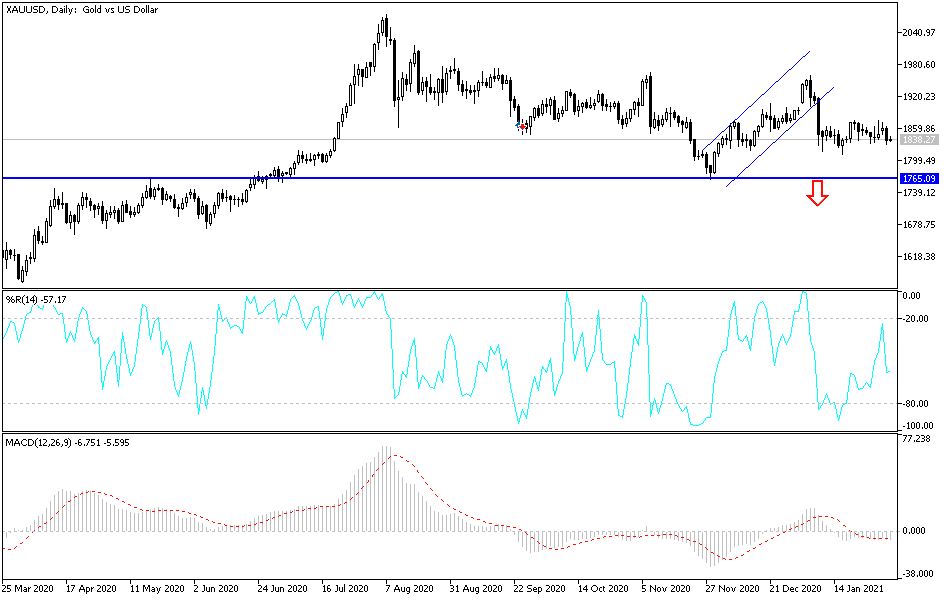
The gold market got absolutely hammered during the trading session on Tuesday following the “short squeeze” in silver that retail traders attempted to cause in the markets. There was a bit of a knock-on effect over here as silver collapsed, and gold found its way back towards the 200-day EMA. Because of this, the market is likely to see a lot of choppiness in this general vicinity, as the 200-day EMA has been closely adhered to as of late. However, the 50-day EMA above also has been roughly adhered to as well, so I think in general we are looking at the likelihood of a lot of choppiness and sideways trading in this market.
Pay attention to the US dollar, though, because if it does take off to the upside in a sign of strength, that could send the gold markets much lower. The $1800 level underneath is supportive, just as the $1750 level is. If we can finally break down below there, then gold falls apart. In the meantime, though, it certainly looks as if we have multiple support levels underneath, and therefore I think they could turn things around to reach to the upside.
One thing that is worth noting on this candlestick is the fact that it is the biggest “real body” that we have seen in some time. Furthermore, the US dollar has been rallying, which will work against the value of gold, not only due to the fact that gold is priced in US dollars, at least as far as this contract is concerned, but also because the US dollar may be rising. The interest rates in America are stronger than many other places around the world and have been for a while. If that continues to be the case, then it does not make any sense for people to take the risk of holding gold when they can simply hold on to treasuries and take the yield by holding that asset. This is a market that I think is trying to form a longer-term base, but it is worth paying attention to the area all the way down to the $1750 level, because if that breaks down, things are going to take an ugly turn rather quickly. To the upside, if we can clear the 50-day EMA then it is likely we will go looking towards in $1900 level.

