Last Monday’s GBP/USD signals were not triggered, as there was no bullish price action when the support level at 1.3709 was first reached that day.
Today’s GBP/USD Signals
Risk 0.75%.
Trades must be entered between 8am and 5pm London time today only.
Short Trade Idea
Go short following a bearish price action reversal on the H1 time frame immediately upon the next touch of 1.3879.
Place the stop loss 1 pip above the local swing high.
Move the stop loss to break even once the trade is 20 pips in profit.
Remove 50% of the position as profit when the price reaches 20 pips in profit and leave the remainder of the position to ride.
Long Trade Ideas
Go long following a bullish price action reversal on the H1 time frame immediately upon the next touch of 1.3759 or 1.3709.
Place the stop loss 1 pip below the local swing low.
Move the stop loss to break even once the trade is 20 pips in profit.
Remove 50% of the position as profit when the price reaches 20 pips in profit and leave the remainder of the position to ride.
The best method to identify a classic “price action reversal” is for an hourly candle to close, such as a pin bar, a doji, an outside or even just an engulfing candle with a higher close. You can exploit these levels or zones by watching the price action that occurs at the given levels.
GBP/USD Analysis
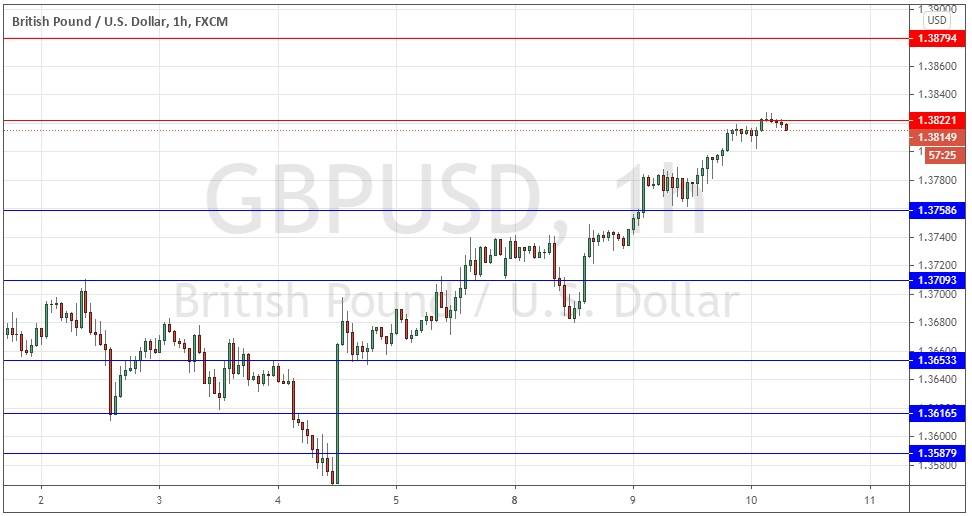
I wrote last Monday that the price was consolidating bullishly just above the support level I had identified at 1.3709, and threatening to break above this truly key, long-term resistance level at 1.3759 which was technically very important.
I was prepared to take a long trade from either a bullish bounce at 1.3709 or after two consecutive hourly closes above 1.3759, up to the resistance level at 1.3822.
This was an indifferent call, as although I was correct over the medium-term, Monday saw the price take a dip below 1.3709 before it turned around and rose.
The picture now is considerably more bullish as we have a sustained bullish breakout beyond the 1.3759 level; in fact, the price even edged above the resistance at 1.3822 a few hours ago. These are new long-term 2.5-year high prices, which is a bullish sign it itself.
The U.S. dollar is broadly weak, and clearly the British pound is one of the strongest major currencies. This produces a situation in which this currency pair is very interesting to trade in the long direction.
I am confident enough to take a bullish bias here if we get two consecutive hourly closes above 1.3825 after London opens, or if we get a bullish bounce following a retracement to the support level at 1.3759.
I will not take any short trade in this currency pair today.
(image10022021gbpusd)
There is nothing of high importance scheduled today regarding the GBP. Concerning the USD, there will be a release of CPI (inflation) data at 1:30pm London time.

