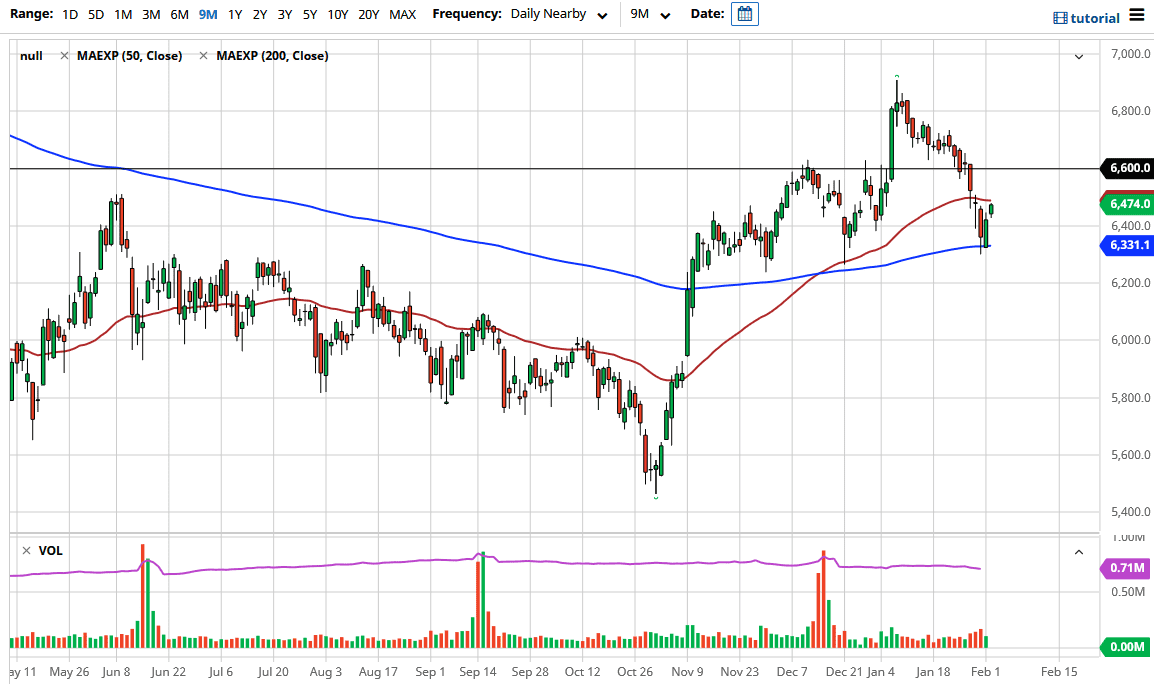
The FTSE 100 gapped higher to kick off the trading session on Tuesday, slamming into the 50-day EMA. The 50-day EMA currently sits at the 6475 area, so if we can break above here, it is likely that we will then go looking towards the 5500 level immediately, followed by the 6600 level which has previously been both support and resistance in this market.
Keep in mind that the British pound is starting to roll over just a bit against the US dollar, so if we can get the pound selling off, that could provide a little bit of extra push to the upside. Regardless, what I do find interesting is that just a couple of sessions ago we bounced quite hard from the 200-day EMA, so it appears to me that longer-term technical traders are definitely looking to get long of this market and take advantage of value.
Yes, the UK economy has been locked down, but at the same time, the vaccination and coronavirus numbers are starting to look better in the UK than many other places around the world. The real fear is probably what happens in a post-Brexit situation, because there are still some things that are not entirely clear as to how they will be handled. Longer term, though, the United Kingdom is not going anywhere. Longer-term traders are probably looking at this as a continuation of an opportunity to get long of one of the world’s largest economies.
To the upside, if we can break above the 6600 level, then I think it opens up a move towards the highs again and perhaps even higher than that given enough time. If we do break down from here and clear the 200-day EMA on a daily close, then I anticipate that the FTSE 100 will go looking towards the round, large, psychologically significant figure of 6000 underneath. That is an area that will probably attract a lot of attention and cause a potential bounce. While I typically do not advocate the idea of shorting a stock index, the FTSE 100 I might be able to make an exception for, due to the fact that there are so many concerns about the British economy in general. If there is one place that we could see some type of significant break down, it is going to be the United Kingdom. However, it looks to me like we are trying to find our footing and go higher.