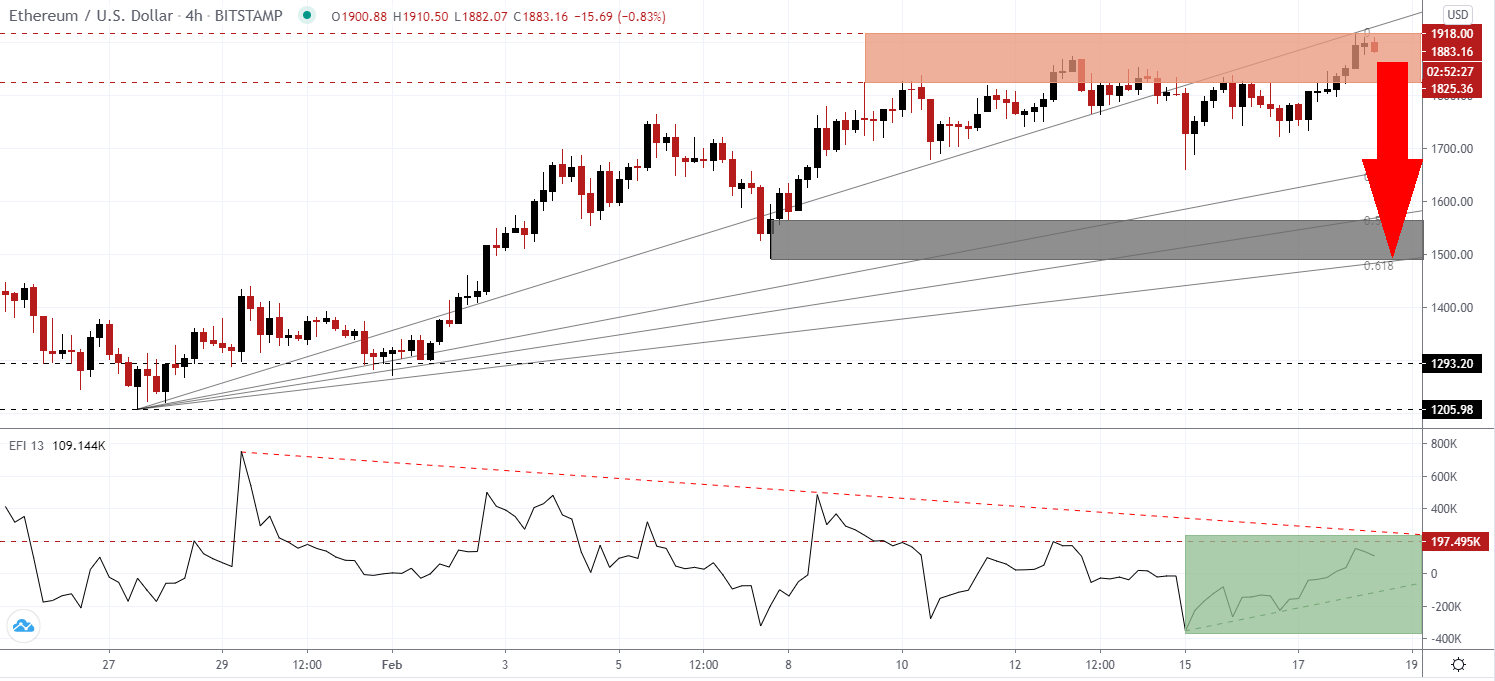
While Ethereum may attempt to cross the psychological resistance level of 2,000, it is unlikely to follow Bitcoin higher in the short-term. While the appetite for dApps, decentralized finance applications, continues to soar, so do scams and fraud surrounding them. The ETH/USD shows signs of technical weakness around its resistance zone from where a profit-taking sell-off can materialize.
The Force Index, a next-generation technical indicator, issued an initial warning with a negative divergence. A lower high kept it below its horizontal resistance level, as marked by the green rectangle. Adding to bearish pressures is the descending resistance level, favored to pressure it below its ascending support level. This technical indicator is on track to move below the 0 center-line and granting bears complete control over the ETH/USD.
With other altcoins offering more value, Ethereum traders may opt to cash out from recent gains. The global risk-on sentiment and more attractive opportunities in smaller cryptocurrencies like Dogecoin and dozens more can offer a selling spark. The ETH/USD remains well-positioned for a breakdown below its resistance zone between 1,825.36 and 1,918.00, as identified by the red rectangle.
There is ongoing frustration with the rising fee structure on the Ethereum blockchain. The latest announcement by AnRKey X to launch its Battle Wave 2323 dApp is the most recent example of scalability issues with Ethereum over the past few months. The ETH/USD can correct into its short-term support zone between 1,492.60 and 1,566.21, as marked by the grey rectangle. The ascending Fibonacci Retracement Fan sequence enforces it.
ETH/USD Technical Trading Set-Up - Profit-Taking Sell-Off
Short Entry @ 1,883.00
Take Profit @ 1,493.00
Stop Loss @ 1,983.00
Downside Potential: 39,000 pips
Upside Risk: 10,000 pips
Risk/Reward Ratio: 3.90
A breakout in the Force Index above its descending resistance level can take the ETH/USD above the 2,000 level. The next resistance zone awaits between 2,088.70 and 2,109.80. Traders should consider adding to their short positions amid bearish short-term pressures in Ethereum and the attractive opportunities in other cryptocurrencies.
ETH/USD Technical Trading Set-Up - Limited Breakout Scenario
Long Entry @ 2,023.00
Take Profit @ 2,103.00
Stop Loss @ 1,983.00
Upside Potential: 8,000 pips
Downside Risk: 4,000 pips
Risk/Reward Ratio: 2.00

