Bullish View
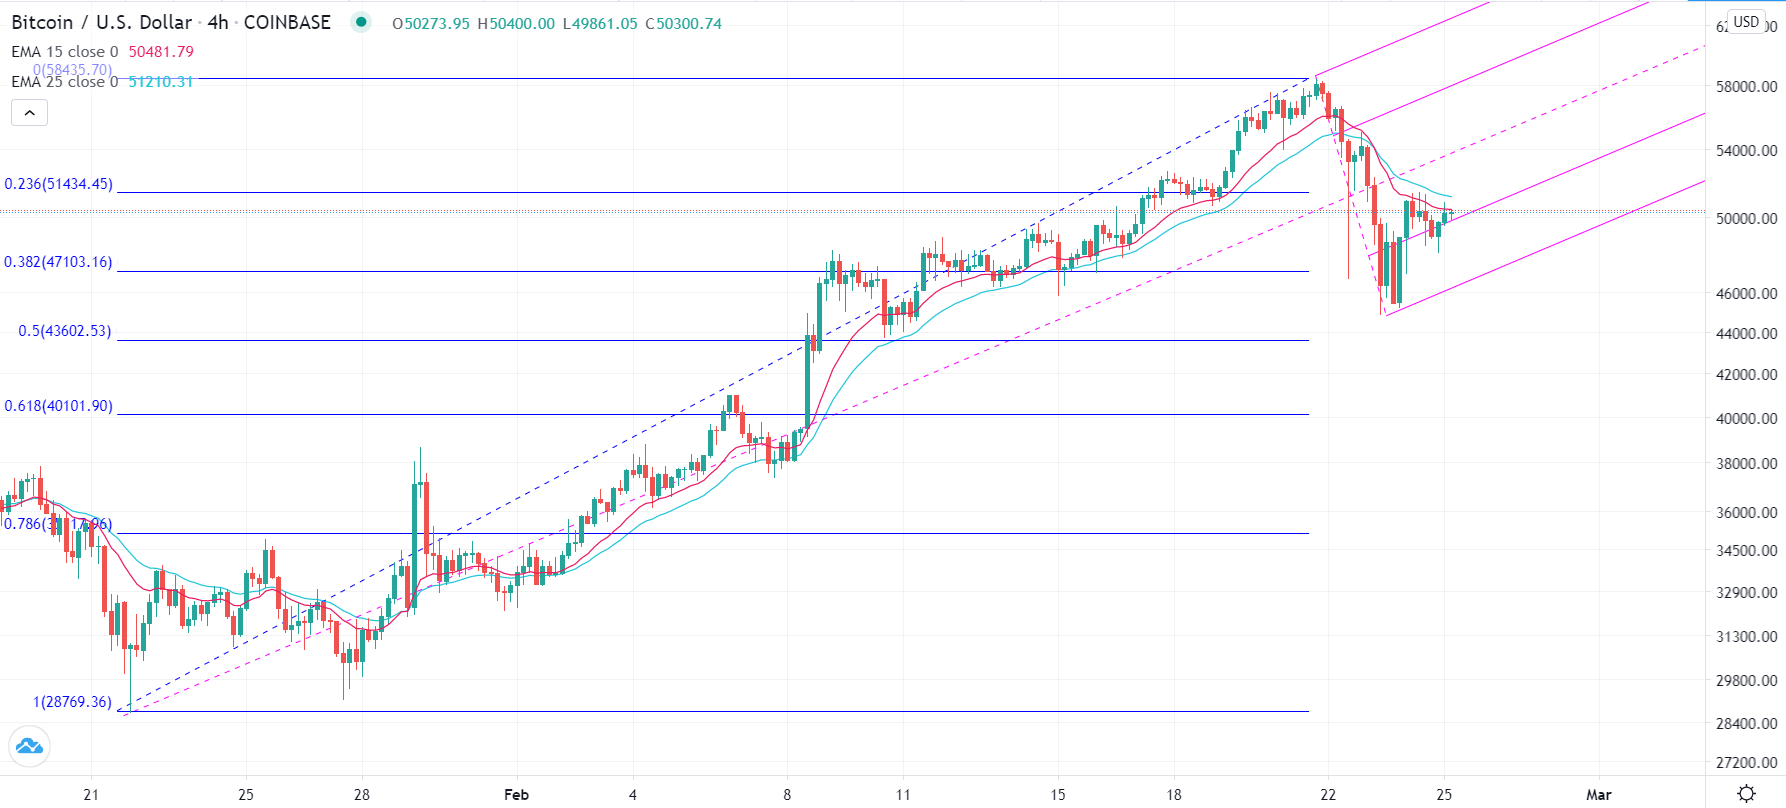
Set a buy stop at 51,440 (slightly above the 23.6% retracement).
Add a take profit at 54,000 and a stop loss at 49,500.
Bearish View
Set a sell stop at 48,166 and a take profit at 45,000.
Add a take profit at 52,000.
The BTC/USD price is hovering around 50,000 as investors question the latest volatility of the digital currency. The Bitcoin price is trading at $50,000, which is 12% above this week’s low of $44,873.
MicroStrategy's Latest Buy
The BTC/USD has stabilized above $50,000 even after news that MicroStrategy has added more Bitcoins. In a recent note, the company said that it had bought Bitcoins worth more than $1 billion. This brought its total Bitcoin holdings to more than $4.7 billion, making it one of the biggest BTC holders in the United States.
Other companies in the US are said to be considering more BTC acquisition after Tesla bought Bitcoin worth $1.5 billion.
Meanwhile, the BTC/USD is also holding steady after Jerome Powell, the chairman of the Federal Reserve, said that the bank will continue with its expansionary policy in the near term.
In the base case, he said that rates will only rise when the unemployment rate falls to below 4.0% and inflation rises comfortably above 2.0%. Therefore, many companies and investors will continue to take advantage of the zero interest rates to buy digital currency.
Meanwhile, there are signs that the Wall Street Bets craze is back. In the past few days, shares of companies like GameStop and AMC have more than doubled. This means that the craze could also back BTC and other popular digital currencies like Dogecoin.
Further, Congress is continuing its deliberations on the next stimulus deal. If it passes, analysts believe that some of these funds will likely flow into Bitcoin and other assets like stocks and gold.
BTC/USD Technical Forecast
The four-hour chart shows that the BTC/USD price dropped to $44,873 early this week. This price was between the 50% and 38.2% Fibonacci retracement level. Today, it is trading at the psychological level of 50,000 that is slightly below the 23.6% retracement.
Notably, the pair is at the first support of the Andrews Pitchfork tool. Yesterday, it struggled to move above the median level of the pitchfork. Therefore, while the overall trend is bullish, in the near term, the bearish sentiment will remain so long as the price has not crossed the median line of the pitchfork.

