Bullish View
Buy the BTC/USD pair above 55,000.
Have a take-profit at $60,000 and stop-loss at 50,000.
Bearish View
Set a sell-stop at 53,000 and a take-profit at 50,000.
Add a stop-loss at 55,000.
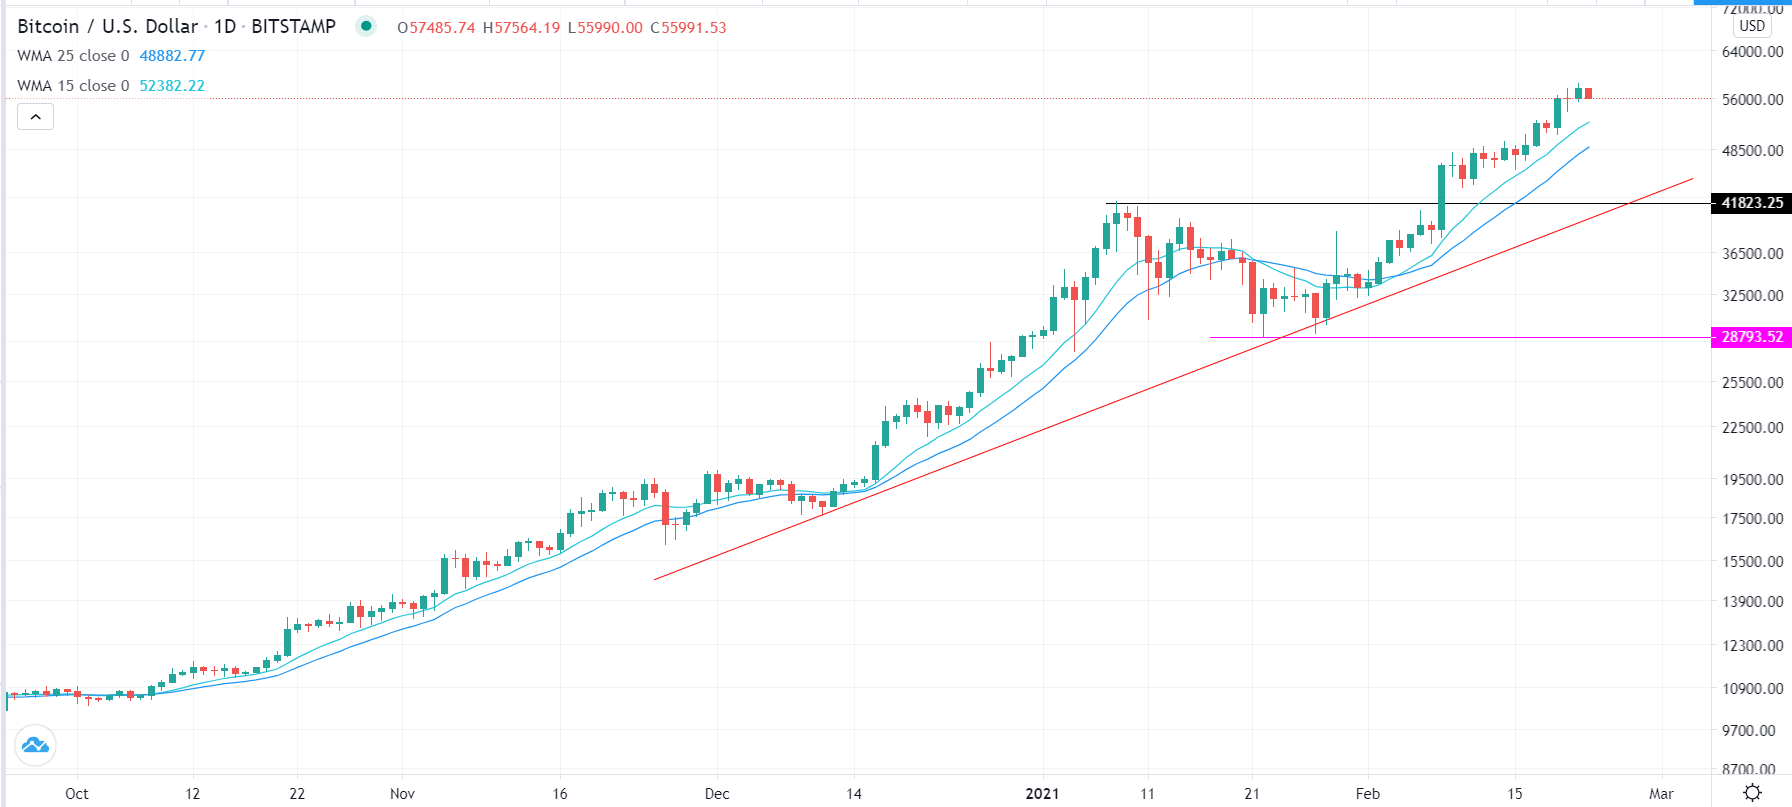
The BTC/USD price pulled back after it reached an all-time high of $58,380. The Bitcoin price is trading at $56,283, bringing its market capitalization to more than $1.06 trillion.
Bitcoin Price Pulls Back
The price of Bitcoin continued rallying during the weekend as investors remained optimistic about the currency. In total, Bitcoin has gained by more than 90% this year alone. Other digital currencies like Ethereum, Binance Coin, and Bitcoin Cash have also surged recently.
This performance is driven by three main factors. First, the Federal Reserve has moved into an expansionary phase in its response to the coronavirus pandemic. The bank has slashed interest rates to zero and implemented a large quantitative easing program.
In total, the bank has already expanded its balance sheet to more than $7 trillion. As a result, this has led to an inflation in asset prices, with stocks and commodities rising to record or multi-year highs.
Second, the BTC/USD price has risen because of the actions by Congress. Washington has already passed stimulus packages worth more than $4 trillion. This week, the House of Representatives will pass another $1.9 trillion package. As such, the actions by the Fed and Congress have devalued the dollar and pushed more people to riskier assets.
Finally, there is now wide acceptance of Bitcoin by institutional investors. Already, a company like MicroStrategy has boosted its market cap from $1.2 billion a few months ago to today’s $8 trillion. The firm has already bought Bitcoin worth more than $1 billion.
This month, Tesla also became the latest large company to buy the currency. Therefore, investors believe that more companies will start buying BTC, which will lead to higher demand.
BTC/USD Technical Outlook
On February 8, the Bitcoin price moved above the important resistance level at $41,823. By then, this was the currency’s all-time high. Since then, it has risen by more than 37%. On the daily chart, the uptrend is being supported by the 50-day and 25-day weighted moving averages (WMA) and the ascending trendline.
Therefore, after crossing the $55,000 level, bulls have started eying the next resistance at $60,000, which is less than 10% above the current price. This bullish trend will remain so long as the price is above the support at $41,823.

