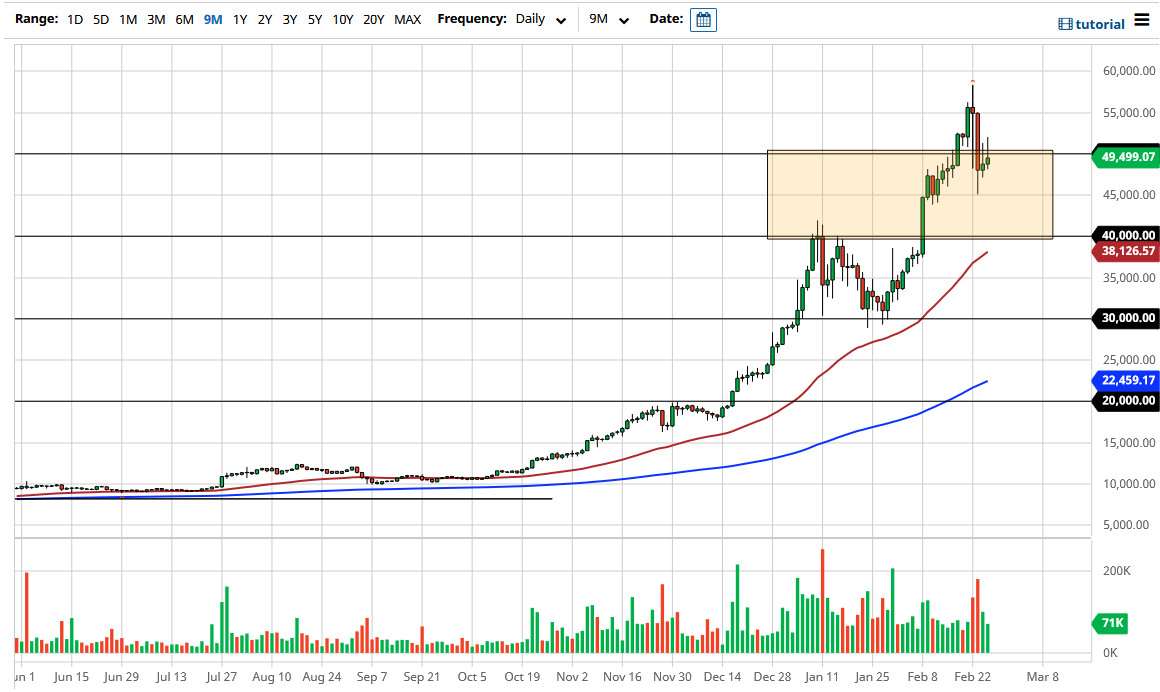
The Bitcoin market initially tried to rally again during the trading session on Thursday but continue to see selling pressure just above the $50,000 level. Because of this, we ended up turning around and forming a hammer for the second day in a row. This is a negative sign, and it suggests that we are probably going to see some type of pullback.
If you remember, a couple of days ago I noted that a 15% drop in Bitcoin is not the type of thing that happens in a vacuum. At the very least, you would expect to see some attempt at follow-through, as the market will have shaken the confidence of some traders. The $50,000 level of course offers a certain amount of psychology when it comes to trading, so the fact that we cannot recapture that level does tell me that we probably have more selling to come. That being said, I am not necessarily suggesting that the market is going to fall apart, rather that I think that we will probably revisit the $45,000 level at the very least. I would not be surprised to see the market break down below there and then go looking towards the $40,000 level, which is the area where we broke out of recently to push towards this area. We have not retested that level, which is typical technical analysis, so it would be interesting to see whether or not to that level to test “market memory.” With even more interesting is that the 50 day EMA is racing towards that $40,000 level, so I think it all makes quite a bit of sense.
This does not necessarily mean that I think that shorting Bitcoin makes a lot of sense, just that we had gotten far too ahead of ourselves and at the very least we need to work off some of the froth from the recent explosive move to the upside. Having said all of that, if we were to turn around a break above these pair of the shooting stars, that would be a very bullish sign, perhaps opening up the move towards the $60,000 level above that I think would be another area where you would anticipate a certain amount of resistance based upon psychological reference more than anything else. In general, I think it does make quite a bit of sense that continue the “buy on the dips” type of situation.

