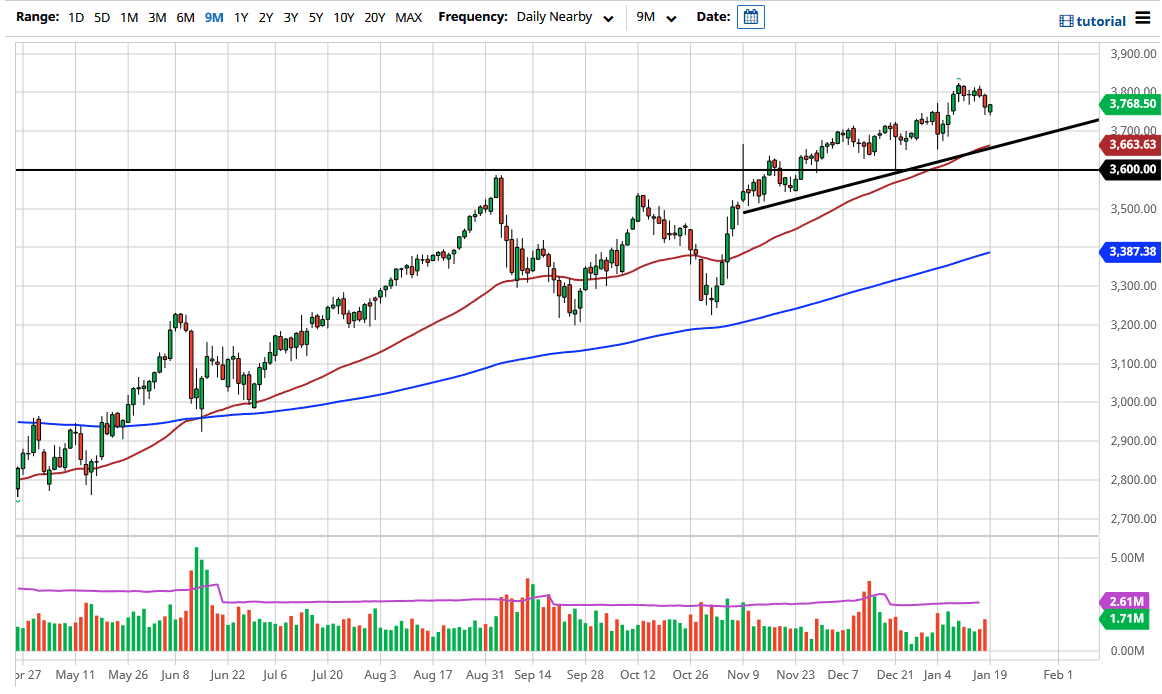
The S&P 500 futures markets gapped to kick off the week to the downside, but then turned around to show signs of life again. The market will continue to see reasons to go higher, if for no other reason than liquidity. We are in the midst of earnings season, which can cause some volatility, but during Martin Luther King, Jr. Day there was no trading of the actual index itself. Electronic trading is typically ignored by Wall Street for the most part, as it has so little in the way of volume comparatively. Because of this, I would not read too much into the action during the day on Monday, and extrapolating that move into anything beyond is a simple lack of liquidity. Remember, Asian traders will typically trade the S&P 500 futures contract in the same way they trade Asian indices, and as they were a little bit muted during the day, that could have an effect on what we are seeing here.
By the time the Americans get back on board, it could be a completely different scenario. I do believe that the reflation trade will continue to be a major driver of the markets, but a pullback does make sense in the short term, due to the fact that we had moved a little bit ahead of ourselves, especially as the stimulus package continues to be tossed around in Congress. Eventually, we will get a significant amount of stimulus that will make Wall Street celebrate, but right now we have the earnings season that could cause plenty of noise. To the downside, the 3700 level would be an area that I would be attracted to, as it is a large, round, psychologically significant figure as well as a structural support level. After that, the 50-day EMA comes into the picture as well, straddling the uptrend line which is a very bullish sign as well. The 3600 level underneath there would also be massive support, so at this point I think this is simply a “buy on the dips” scenario that we should be watching.