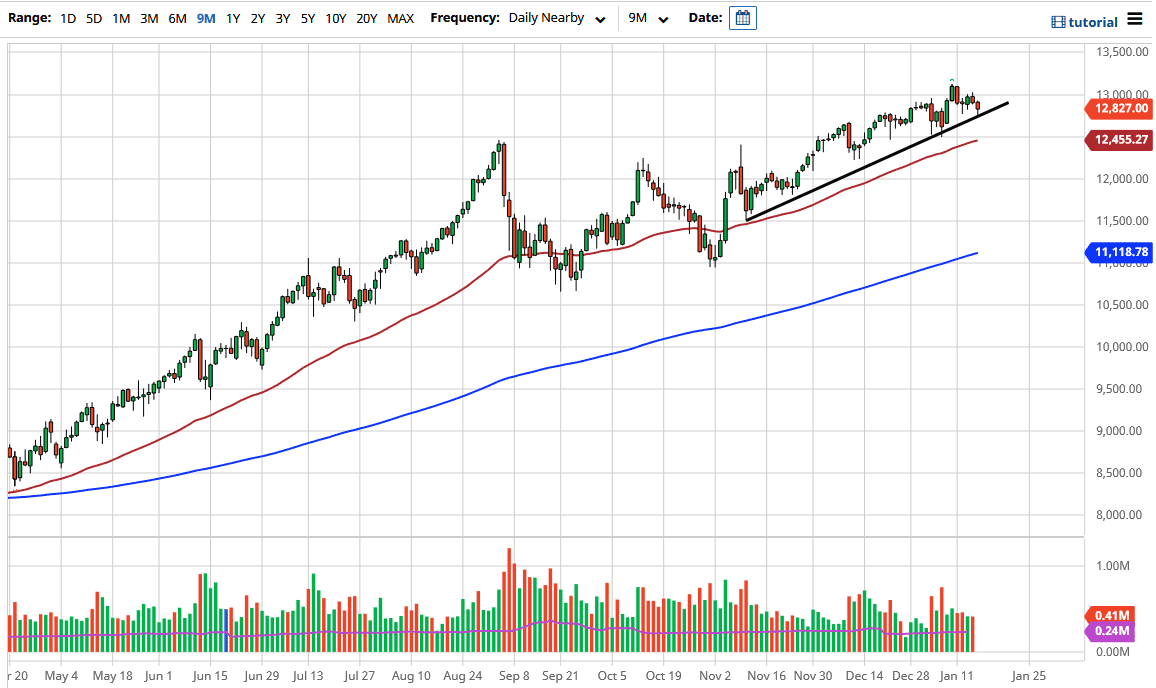
The NASDAQ 100 fell a bit during the course of the trading session on Friday as we continue to see the markets show quite a bit of volatility. Ultimately, this is a market that has been holding a trendline for a while, and even with the selling on Friday we continue to see more the same. The NASDAQ 100 is a market that people flood into two by a handful of stocks more than anything else, and that has been the way for years.
Part of the problem that we had on Friday is the fact that people are concerned that Joe Biden is only going to get 1.1 trillion in stimulus spending instead of 1.9 trillion. Granted, this needs to be repriced a little bit but at the end of the day stimulus will continue to flood the markets with liquidity, and therefore asset prices will continue to go higher over the longer term. The NASDAQ 100 is almost the perfect vehicle to do this, simply because it is all of the handful of major technological company that everybody wants to own. Dips should be bought in the NASDAQ 100, but if we were to break down below the trend line, then we probably have to go looking towards the 50 day EMA which is currently at the 12,455 level. As an area that coincides quite nicely with previous support anyway, so I think it all ties together quite nicely.
Regardless, I have no interest in shorting this market because over the last 13 years it has been fairly rare that you can short the market with any type of big move back in. These big moves get jumped into by the Federal Reserve, and sometimes US government. In other words, Wall Street is protected and therefore they have been taught over the last several years that losses are going to be protected. To the upside, I believe that this market is probably going to go looking towards the 14,000 level, based upon the previous consolidation area and the measured move from the breakout. I do not know how long it takes to get there, but clearly it is an area that a lot of people will be paid attention to as it is a large, round, psychologically significant figure. In the meantime, the 13,000 level looks to be the first barrier.

