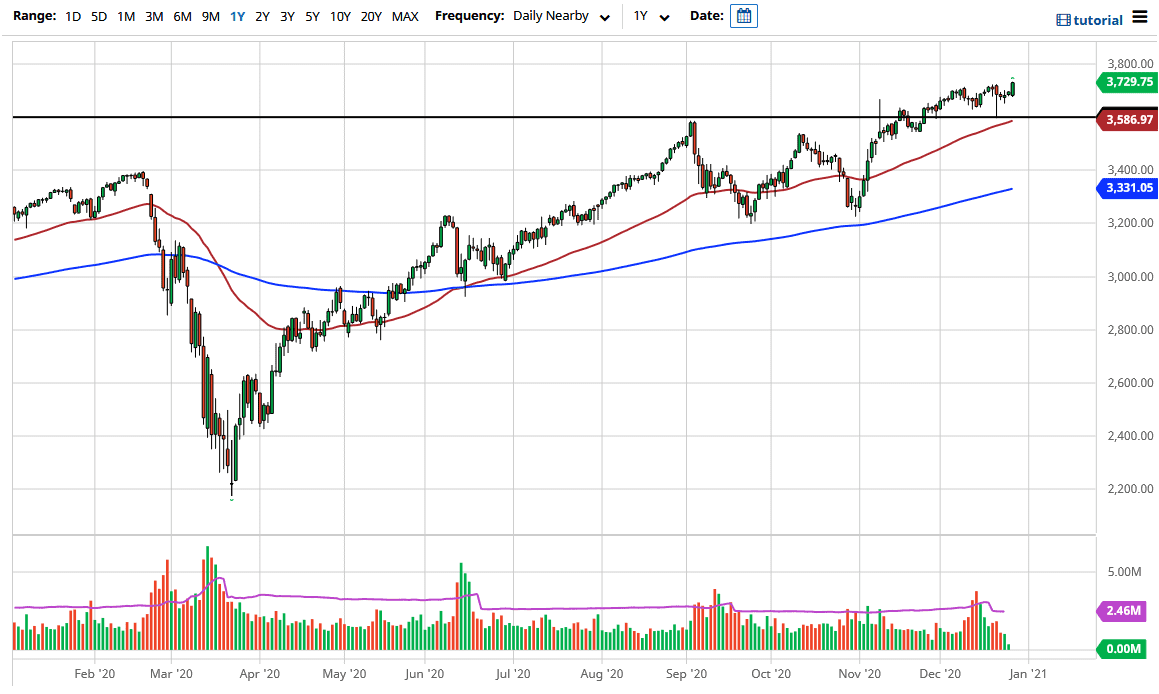
The S&P 500 had a very strong session during the day on Monday as traders came back from the Christmas holiday. We still have to deal with the New Year’s Day holiday, so now that we are between those two holidays, we quite often see gains. Adding to the historical drive to the upside, we also have the stimulus signed by President Donald Trump, which suggests that we will get more of that “cheap money” heading into the economy, thereby driving more money into the equity market.
The 50-day EMA sits underneath the 3600 level, which is a large, round, psychologically significant figure, and where we had pulled back to late last week and found plenty of buying pressure. Beyond that, the 3600 level was also a major resistance barrier that we broke above, and the top of a consolidation area between 3600 and 3200. The 400-point range does suggest that we can extrapolate the move from the 3600 level to go looking towards the 4000 handle. That is my longer-term target, so I think that the dips will continue to be bought into as we continue to see them as potential buying opportunities.
This will be especially true if the US dollar continues to shrink in value, but what I do find interesting is that even while the US dollar strengthened a bit during the session, people still jumped into the stock market. Perhaps it is because people are buying US stocks and shunning other ones. We will have to wait and see; but right now, it certainly looks as if we are ready to go to the upside. The 4000 level above is going to be very difficult to break out of, and we have a lot of issues between here and there. The candlestick for the trading session is closing at the top of the range, which is a very bullish sign and suggests that we are going to continue seeing momentum to the upside. Typically, when you close at the very top of the range, you see continuation going forward. Short-term charts can be used as buying opportunities with an eye on 3600 as a “hard floor” in the market.

