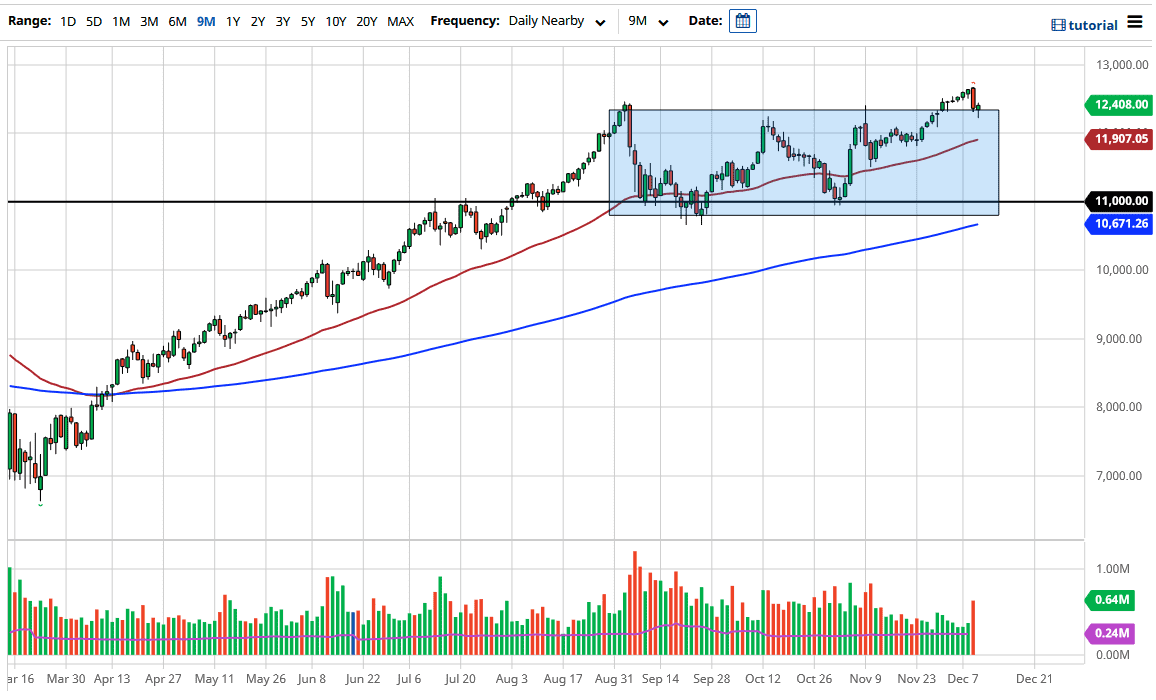
The NASDAQ 100 initially fell during the course of the trading session on Thursday to break down below the 12,400 level. This looks like we will continue to see this market go much higher. After all, we have just broken above resistance and now retested it. By forming the hammer that we have for the Thursday session, the market is likely to turn around and climb.
The initial move could be to wipe out the losses from the trading session on Wednesday, which means that we could go looking towards the 12,675 level. Underneath the hammer that we have just formed, there is even more support at the 12,000 handle, especially now that the 50-day EMA is reaching just above the 11,900 level. The market is likely to see a “buy on the dips” situation, so we are looking at an opportunity to cash in on the “Santa Claus rally” that should be coming as we head towards the end of the year.
Pay attention to the stimulus talks, because it is very likely that we are going to continue to see the market try to price in stimulus and thus push itself out into the risk curve. have no interest in shorting the NASDAQ 100, as it is made up mainly of the stocks that everybody loves, so it is difficult to start shorting it. You need to look at any pullback as a potential value proposition and pick up bits and pieces as you get the opportunity. Underneath at the 50-day EMA, I expect to see a lot of fighting to support the market, and if we break down below there then I would probably sit on the sidelines and wait to see if we can get down to the 11,000 handle, which is a large, round, psychologically significant figure.
The 200-day EMA is just below there, which could make a certain amount of psychological significance as well, so everything would lineup due to the 200-day EMA, the large round number, because we have already seen support there previously.