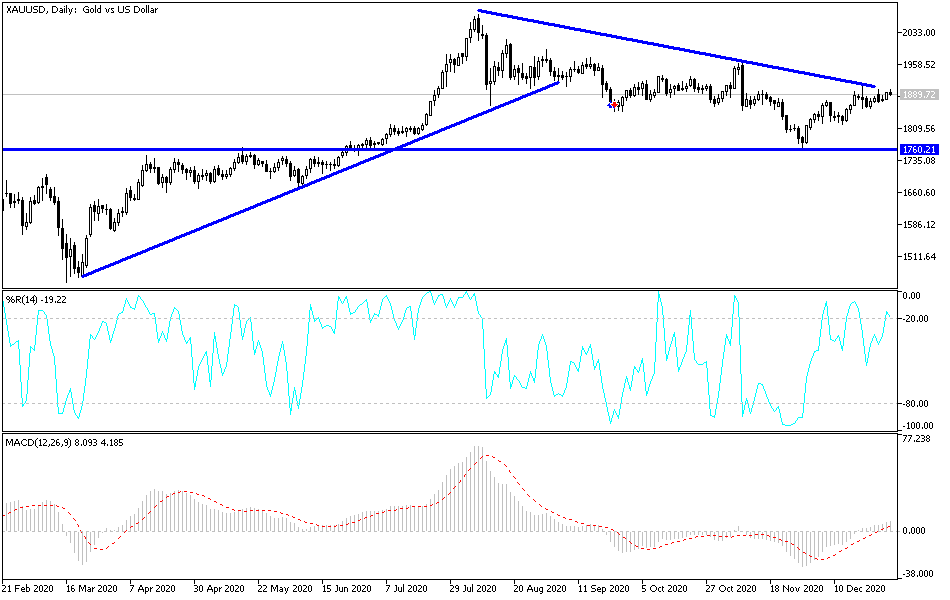
The price of gold received support from the USD's decline and tried to break through the level of psychological resistance at $1900 an ounce, which it reached at the beginning of this week’s trading. The price then retreated to $1871, and before the close of transactions for the year, the price of gold moved to the resistance level at $1899 per ounce, before stabilizing around $1887 an ounce as of this writing. Therefore, it must be taken into account that the dollar's recovery will have a strong negative impact on gold's recent gains. It appears that the price of gold is also close to the overbought levels of the 14-hour RSI. It is also trading above the 100-hour simple moving average while the 200-hour simple moving average is just below current levels. The current rebound that started at the beginning of the month has now pushed the price above the 61.80% Fibonacci level.
It seems that the price of the yellow metal is experiencing noticeable activity amid the high number of coronavirus cases. The recent US stimulus package of $900 billion has created a short-term bias towards safe-haven assets like gold. At the same time, it appears that the progress in vaccination has fallen below target numbers. Earlier in the month, reports had indicated that the United States was hoping to vaccinate 20 million people before the end of the year. But the data showed that only 11 million vaccine doses have been shipped, with only 2.1 million people taking it so far.
Based on the latest US economic data, the Chicago PMI for December beat expectations at 57, with a reading of 59.5. On the other hand, November pending home sales missed the expected change (monthly) of 0.0% with a change of -2.6%. On Tuesday, October's S&P/Case-Shiller home price indices outperformed the expected (annual) change of 6.9% with a change of 7.9%. Today, investors will be looking forward to the US weekly jobless claims number.
On the other hand, the US dollar dropped against all major currencies and many emerging market currencies as it appears that the foreign exchange markets have ignored the creeping spread of tight restrictions related to the coronavirus in the United Kingdom and elsewhere before the end of the year.
Technical analysis of gold:
In the short term, and according to the performance on the hourly chart, it appears that the price of gold is stable inside the formation of an ascending channel. This indicates a slight upward slope in the short term in market sentiment. It is now closer to the overbought levels of the 14-hour RSI. Accordingly, the bulls will target short-term profits at around $1918 or higher at 1942. On the other hand, the bears will look to profit from a pounce on short-term pullbacks around $1865 or lower at $1842.
In the long term, and according to the performance on the daily chart, it appears that the yellow metal price is trading within a descending channel formation. It has now decreased, trading between 23.60% and 38.20% Fibonacci retracement. Accordingly, the bulls will target long-term profits at around $1982 or higher at 0.00% Fibonacci at $2072. On the one hand, the bears will be looking to bounce at $1798 or lower at the 61.80% Fibonacci level at $1697.

