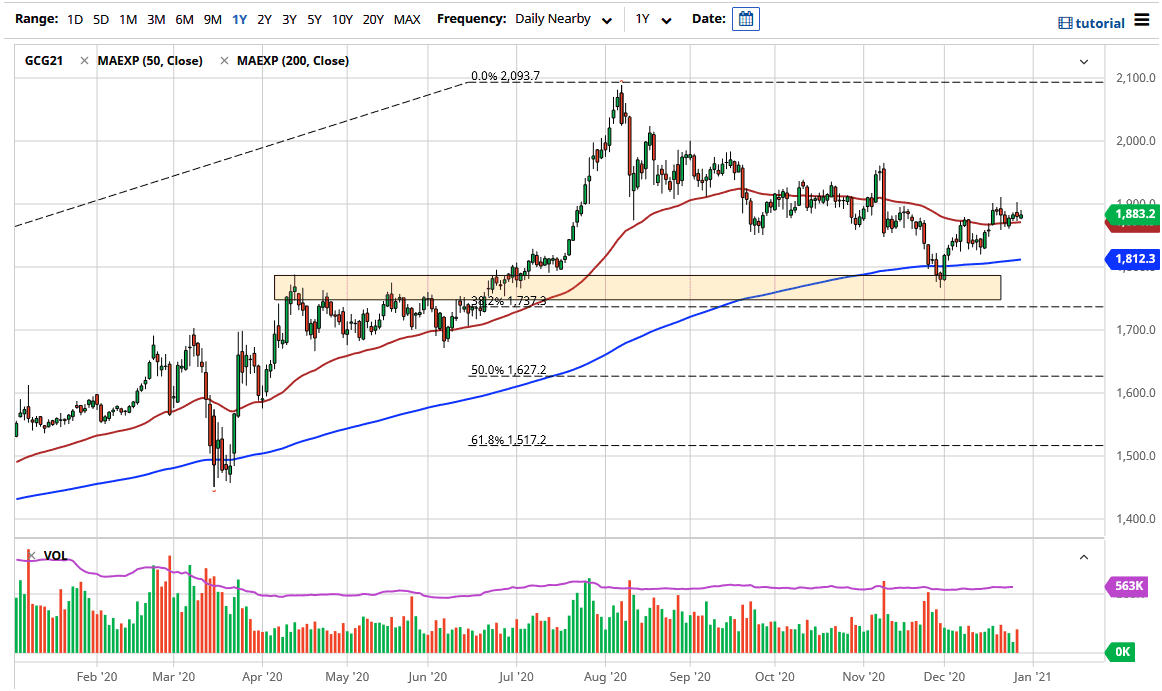
Gold markets continue to hover just below the $1900 level during trading on Tuesday, as we simply have nowhere to be. We are sitting on top of the 50-day EMA, which is somewhat supportive from a technical analysis standpoint, but the market looks as if it is respecting the $1900 level as significant resistance. You also have to keep in mind that this is one of the thinnest times of the year, due to the fact that most people are focused on the holidays and not on trading. With that, it is not a huge surprise to see that the market really does not feel the need to move very significantly.
The 50-day EMA continues to offer a bit of buying pressure, but I do not think that there is anything particularly special about this indicator, just that a lot of people use it as a proxy for short-term momentum. The market breaking above the $1900 level eventually does make sense, due to the fact that there has been so much stimulus in the United States and it is likely that we will continue to see even more. On the breakout above the $1900 level, the next serious resistance barrier is somewhere near the $1950 level where we had formed a massive red candlestick. After that, we are looking at a move towards the psychologically and structurally important $2000 level.
I do not think that we will go straight up in the air, so pullbacks are very likely. Every time this market pulls back, I have an interest in buying just a little bit of gold, because you can take your time and build into a position. This is more or less a longer-term trade, especially now that the 200-day EMA, pictured in blue on the chart, has been respected as support. Furthermore, it is not just the United States that is going full-blown with its stimulus, so a demand for precious metals should be built into the marketplace expectation in 2021. I do not have a scenario in which I'm willing to sell gold at the moment, and I look at the most recent action as a bit of a bottoming pattern.

