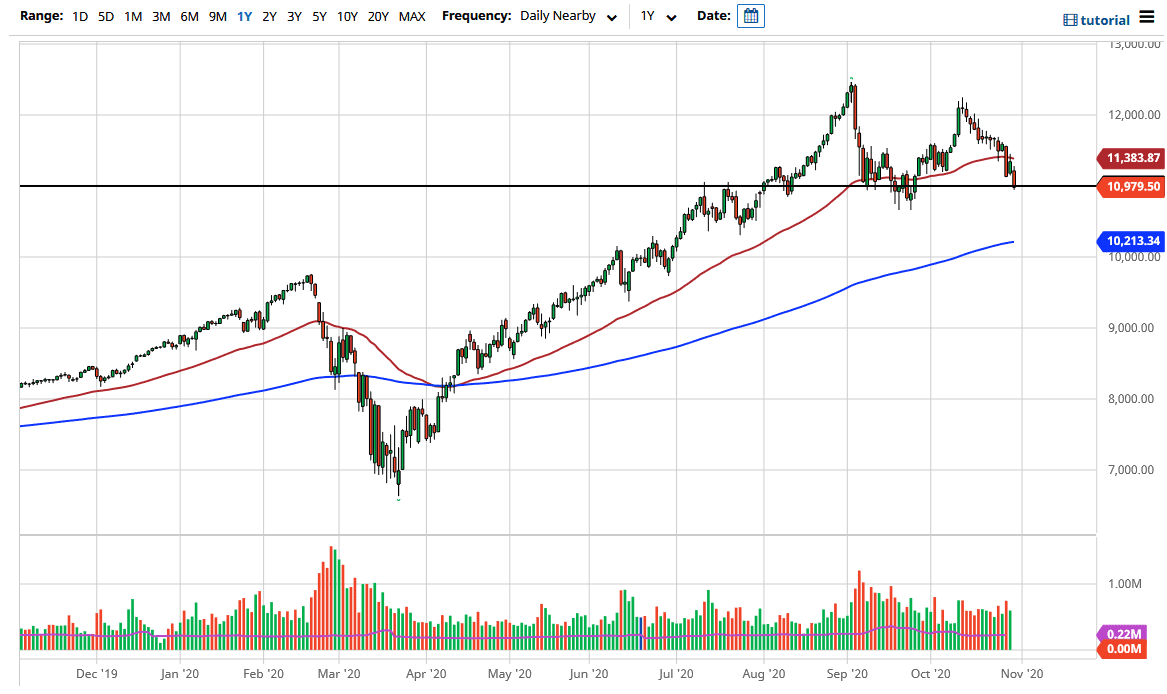
The NASDAQ 100 has fallen rather hard during the trading session on Friday, rapidly slamming into the 11,000 level. However, I see a significant amount of support underneath extending down to the 10,600 level, perhaps even lower than that. If we do break down below that level, then the market is probably going to go looking towards the 200 day EMA.
One of the things that you need to pay attention to in this market is the fact that the big four technology companies are in the crosshairs of the United States Congress, which has caused some issues. After all, they are large movers of this index, so we need to pay attention to what is going on. There are a whole slew of other issues that are coming into play as well when it comes to the NASDAQ 100.
The US dollar continues to strengthen, which is worth watching. I do not like shorting this index, even though we are just about 350 points from confirming the “M pattern” that is also showing itself in the S&P 500. While that is technically a negative sign, and could get people selling, I am very cautious about shorting indices these days because they are so highly manipulated, and they are not equally weighted. What I would do is start buying the US dollar if this does in fact break down, because it tends to move in an extreme negative correlation to this index and many others.
The size of the candlestick does suggest that we are going to go lower, so if you are looking to day trade this market, then you are trying to fade short-term rallies that show signs of exhaustion. However, as we go into the weekend, there are a lot of concerns when it comes to various headlines, so it is possible that we also get a good headline. That could send this market straight back up in the air, but I think the 50 day EMA is going to cause a certain amount of resistance. Either way, I am not a buyer. But just like the S&P 500, if we break down then I would buy the US dollar as it has a -.90 or more correlation.