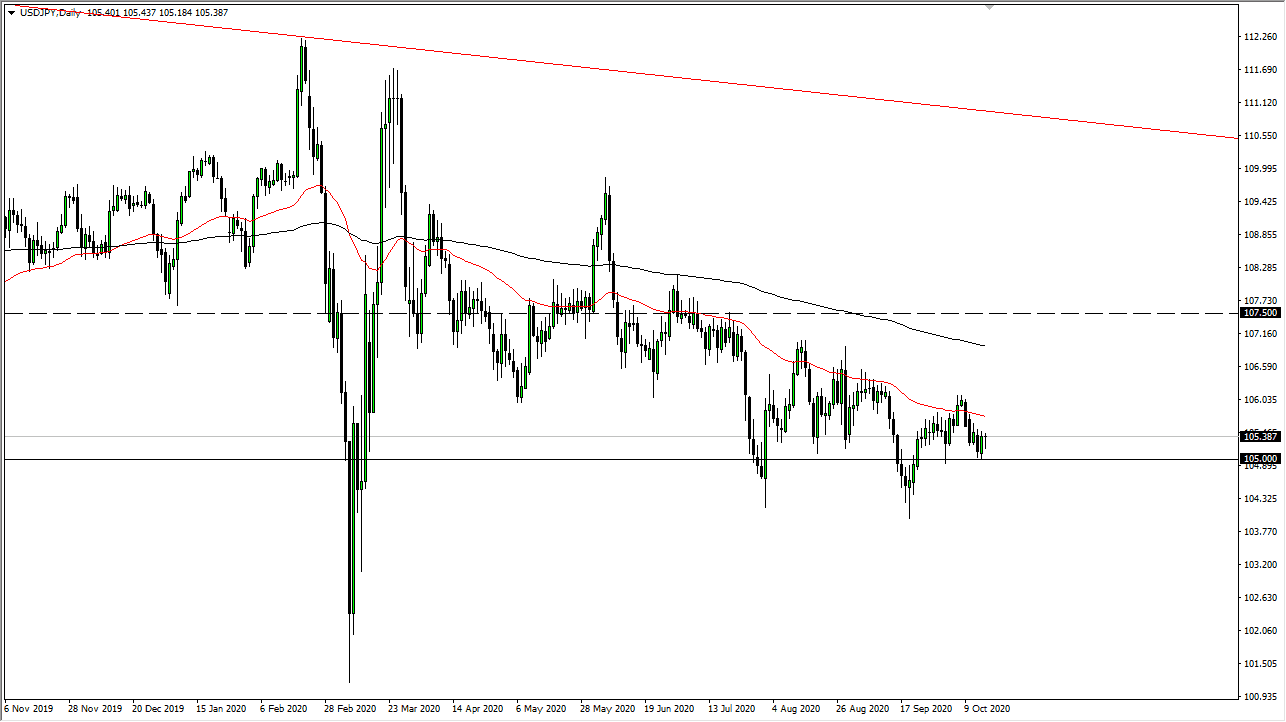
The US dollar initially pulled back a bit during the trading session on Friday, reaching towards the ¥105 level. That is a large, round, psychologically significant figure, and an area that would be very attractive for longer-term traders. The fact that we bounced during the trading session is a bullish sign as well, but there is a multitude of reasons to think that a rally might be temporary.
The 50 day EMA above shows significant resistance as the market has been paying close attention to that indicator. The 50 day EMA has been significantly resistant more than once, as you can see on the chart. The 50 day EMA is the beginning of resistance all the way to the 200 day EMA as there is a “no man’s land” of resistance in that general vicinity. It is not that we cannot break into this area but breaking above there would be very difficult to imagine, as we have been grinding lower for so long.
The candlestick for the day on Friday was a bit of a hammer, so it is likely that we will probably continue to see a lot of back and forth and perhaps an attempt to bounce. Ultimately, I think this only leads to yet another selling opportunity and if you look at the longer-term chart you can make out a bit of a descending triangle. The descending triangle suggests that we go much lower, but the first area that we need to break through is the ¥105 level. Once we do, the market then goes down towards the ¥104 level, possibly even breaking below there to go down to the ¥102 level. This is an area where we have seen a lot of buying pressure previously, and where we rallied significantly and have only started to grind lower from that initial push ever since.
As far as trying to buy this market, I have no interest in doing so right now because the US dollar is probably going to grind a bit lower due to the fact that stimulus is coming. Then there is also the fact that the Japanese bond market offers more in the way of yield than the US market, something that is quite abnormal for markets. Nonetheless, it looks to me like rallies continue to be selling opportunities to take advantage of.

