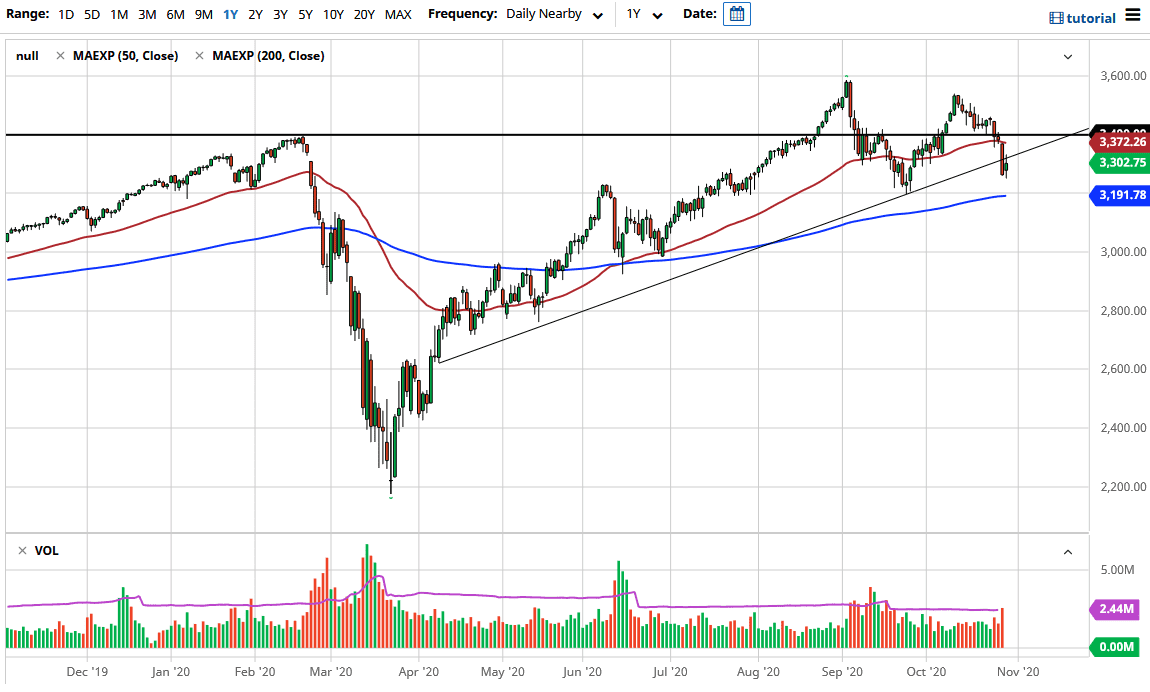
The S&P 500 has gone back and forth during the trading session on Thursday, stabilizing a bit after the extreme negativity during the Wednesday session. This is a good sign, because we needed to see this in order to find a reason to get bullish again. That being said, there are a lot of things that could cause issues, so that something that is worth paying attention to.
The first thing that you should notice is that we are just below a significant uptrend line, so that suggests that we could see a little bit of resistance, and we did in fact see that resistance come into play. That being said, if we can break above the highs of the trading session from Thursday, it is very likely that we will go looking towards the 3375 area where the 50 day EMA sits. Alternately, if we break down below the candlestick for the trading session on Thursday, then we will probably go looking towards the 3200 level.
The reason that the 3200 level is important is that it was previously a major support level that we have bounced from, not only due to the fact that it is a large, round, psychologically significant number, but also the fact that it had previously been important. Beyond that, we also have the meeting of a nice uptrend line. Furthermore, we also have the 200 day EMA in that area. Having said that, it is likely that the market will find plenty of support in that area.
If we were to break down below the 3200 level could open up a bit of a trapdoor to the market, sending it much lower. However, we should keep in mind that the election is coming and that will probably keep the market somewhat compressed. There is money flowing into the United States due to the fact that people are running from the European Union right now due to the coronavirus lockups. At this point, I believe that we are still essentially range bound but towards the bottom of it. The candlestick for the trading session look somewhat promising, but it is just the first step in turning things back around in what had been an extraordinarily negative market over the last couple of weeks. With this, I am cautiously optimistic but just for the short term.