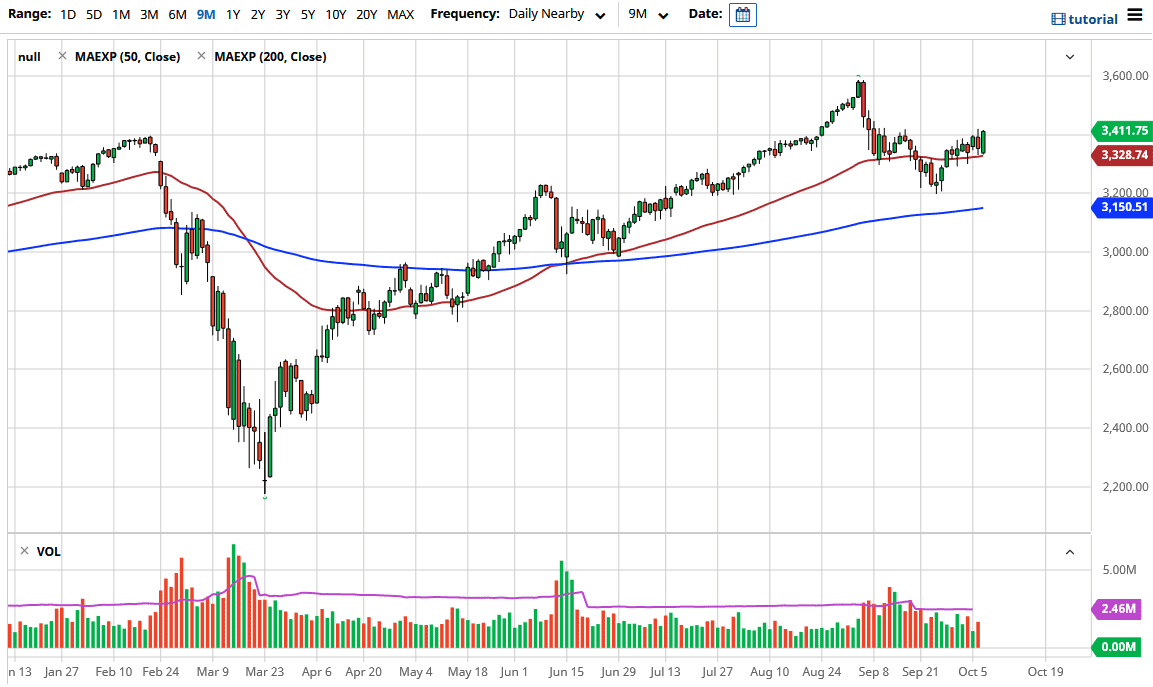
The S&P 500 continues to go back and forth, showing signs of strength but at this point we are simply waiting for the next governmental handout in order for Wall Street to go forward. If we can break above the 3425 level on a daily close, then it would signify a breakout in the S&P 500, perhaps opening up a move towards the highs again. This would jive pretty well with the narrative on Wall Street that they will “do whatever it takes to get something done before the election.” I do not necessarily think that is a complete certainty at this point, so I would be very cautious about throwing a ton of money into the market.
Looking at this chart, the 50 day EMA has offered temporary support, and has done so for the last week or so. That being said, the moving averages are essentially flat, so that is something to keep in mind. If we pull back from here it is likely that there are support levels underneath on short-term charts, but this is a market that is simply trading on the latest Tweet. If you did not believe that, then you obviously were not paying attention yesterday when Donald Trump suggested that stimulus would not be negotiated between now and the election. The market fell apart almost immediately.
Pay attention to the US dollar, if the US dollar starts to fall, that is generally good for the stock market as well. Because of this, I think you should be paying attention to the fact that the US dollar has been rather choppy, and that explains what is going on here. However, the market is looking very much like one that is forming some type of “V bottom”, which is something worth paying attention to. All things being equal, stocks only go up over the longer term so I think that there will be a lot of buyers out there looking to take advantage of value on short-term dips. The 50 day EMA is the most obvious place to be buying from, but of course a breakout is very possible, especially if Donald Trump starts tweeting again. Having said that, he can also have the opposite effect. We are literally trading on the latest rumor about stimulus, which of course reminds me of the British pound and Brexit.