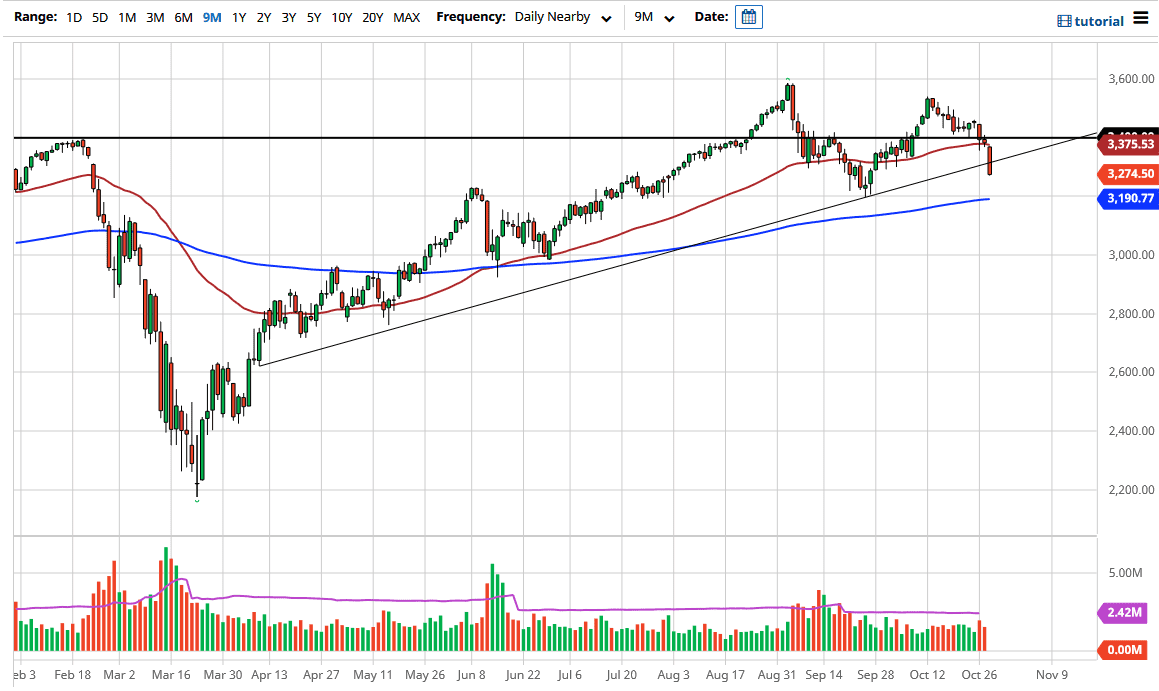
The S&P 500 broke down significantly during the trading session on Wednesday, slicing through a trendline that I have been paying attention to for some time. Now that we are below the 3300 level, we are going to eventually see some type of court coming sooner or later, but the 200 day EMA sits just below the 3200 level, which is right where we had recently pulled back from. A lot of people have been emailing me about a potential “double top”, but it is not until we break down below the 3200 level until we actually confirm that.
The candlestick for the trading session on Wednesday is essentially a marubozu candlestick, which is a very convincing one, meaning that we essentially just fell significantly, and then close that the very bottom. This tells you that there is probably more follow-through coming in this market to the downside, but I do not think that we are suddenly going to melt down. Yes, there is a lot out there when it comes to things to worry about, but we also know that it is only a matter of time before Wall Street find some type of narrative to start buying again.
Looking at this chart, the market is also supported at the 3000 level, but I think at this point in time it would not be very surprising to see this market turned back around. Ultimately, I think it is only a matter of time before something comes down to have people buying again, but I do not believe that we suddenly turn around and spike higher. I think that as we are so close to the election, we have a lot of noise in this market back and forth. Looking at this chart, the 3200 level is important, just as the 3400 level is. Ultimately, I prefer looking for value on a daily candlestick in order to get involved in a market that is clearly balanced to go higher over the longer term, but obviously there are a lot of people out there that continue to worry about a whole host of issues, not the least of which would be Brexit, and of course the European Union shutting down various economies. Now people are starting to worry about whether or not the United States is going to do something similar.