The NASDAQ 100 has gone back and forth during the trading session on Tuesday. This shows that we still have a lot of confusion out there, as we have no idea where we are going to go next. The NASDAQ 100 of course has to deal with the fact that Google is going to be sued by the Department of Justice, which of course does put a bit of weight upon technology companies.
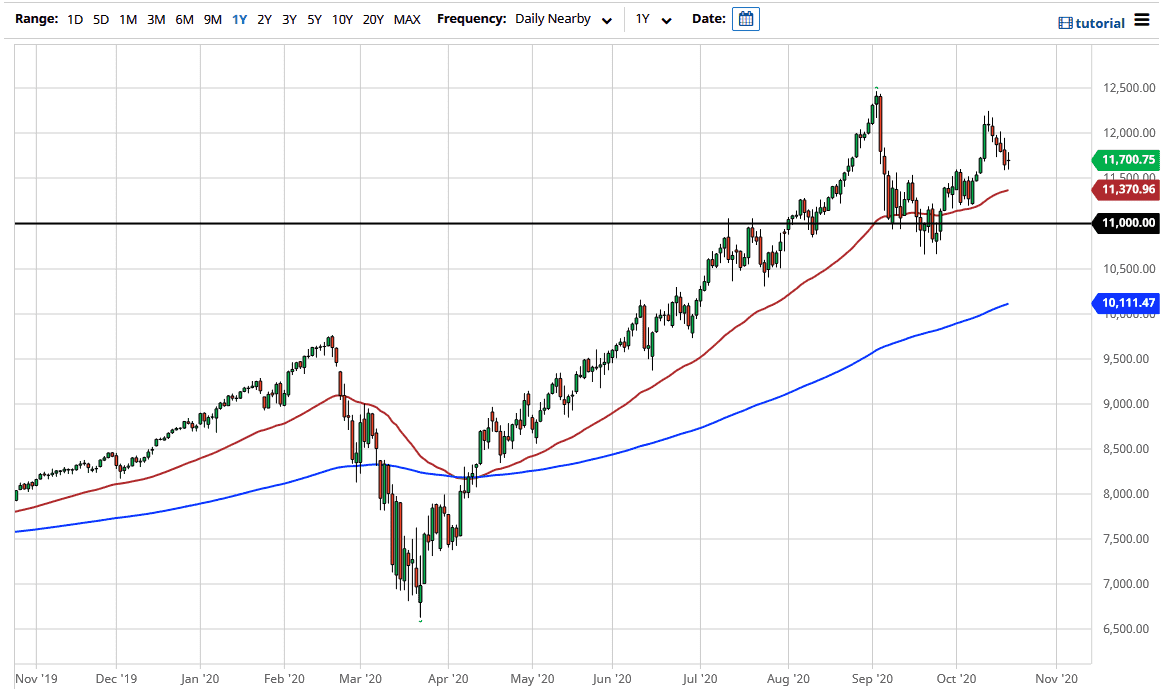
Looking at this candlestick for the day, it shows that there is a bit of confusion and I think that it is only a matter of time before we have to make some type of decision. Ultimately, the area just below, especially near the 11,500 level shows signs of potential support, as it has previously been resistance. I think at this point we are more than likely going to find buying on dips, but keep in mind that the stimulus situation of course is going to be a moving target as well.
Looking at this chart, the 50 day EMA is starting to reach towards the 11,500 level, so that gives yet another reason to think that might matter. Even if we break down below there, I think that the 11,000 level would be significant support as well. With that being the case, the market is trying to continue to push higher, even though we have recently formed what some people would look at as a potential “double top.” Regardless, this is a market that I think will continue to find reasons to go higher, due to the fact that the idea of cheap or free money coming out into the economy will have buyers looking for opportunities to go long. Ultimately, I do think that this is an index that you cannot sell, because you simply cannot sell financial assets that are designed to go higher.
If we can break above the top of the candlestick for the Tuesday session, it is likely that you are going to go looking towards the 12,000 level, and then possibly even break to a fresh, new high. Even if we break down below the 11,000 handle, then you start looking at the 200 day EMA which is closer to the 10,000 level. All things being equal, because the NASDAQ 100 is only a handful of stocks more than anything else, and those are obviously all the darlings of Wall Street.