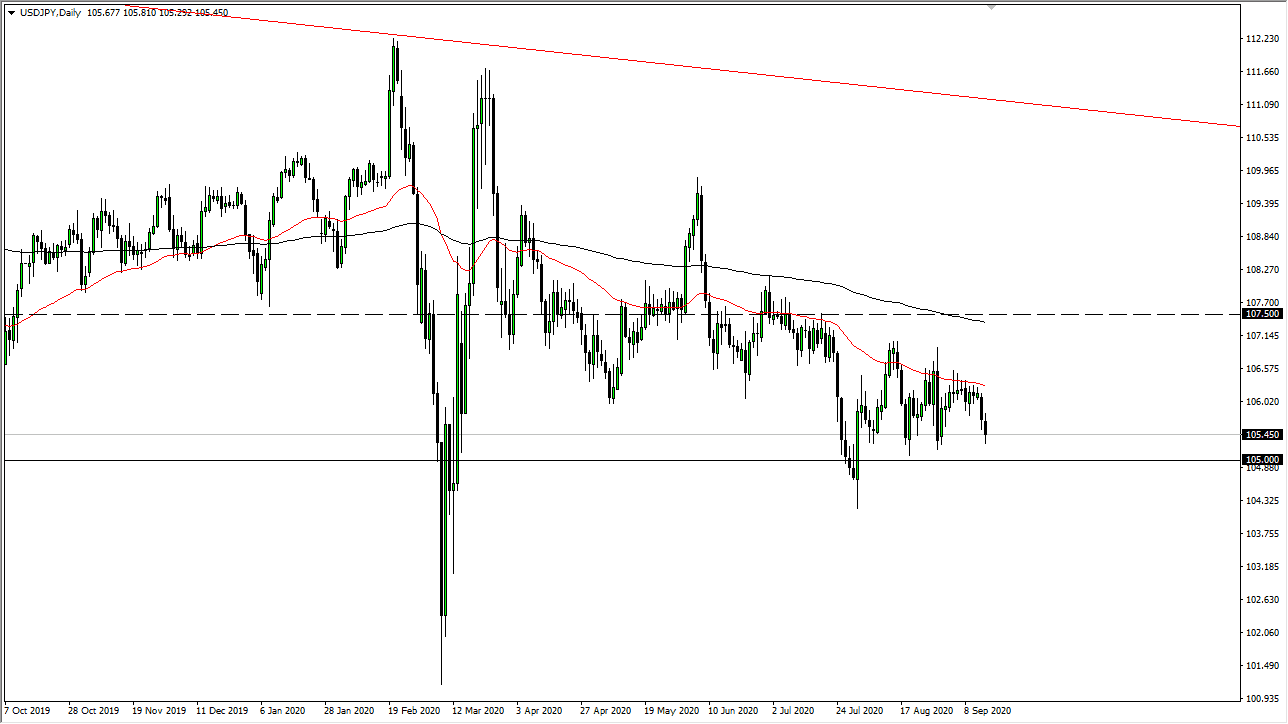
The US dollar has fallen again during the trading session on Tuesday, as we continue to see the Japanese yen strength and overall. At this point, the ¥105 level should see plenty of support, so if we were to break down below that level it would certainly mean something. After all, we have tested it several times now, and there is an obvious buffer of support that extends about 50 pips above there. If that gives way, look out below because this is a market that will start crashing rather hard.
If that happens, the initial target will be the ¥104.33 level, followed very rapidly by the ¥102 level if we broke that level as well. When you look at the target, it does seem like it a bit of a distance, but it is also obvious that we are trying to form some type of descending triangle, so it does make a lot more sense when you start looking at that. The 50 day EMA is offering resistance as well, so at this point in time, there are far too many technical things pointing to the downside when it comes to the USD/JPY pair.
In fact, I do not even have a scenario in which I’m willing to buy this pair, because if we start to get a bigger “risk-on” type of market, you probably will do better in the GBP/JPY pair, NZD/JPY pair, or something along the lines of that. After all, in a “risk-on environment”, people will start to focus on the Federal Reserve dumping US dollars, so even if this pair does rise in sympathy, it will not rise as much as the other pairs. Remember, currency trading is a relative strength or weakness game. Why short the Japanese yen against something else that would barely move when you can do it against something that is really going to take off in your direction?
Longer-term, I do believe that if we drift lower, and the 50 day EMA above is the beginning of a massive area of resistance that extends all the way to the 200 day EMA at the lease, if not the ¥107.50 level which has been so structurally resistive. In other words, I sell rallies at signs of exhaustion such as shooting stars on 30-minute charts, that type of thing.

