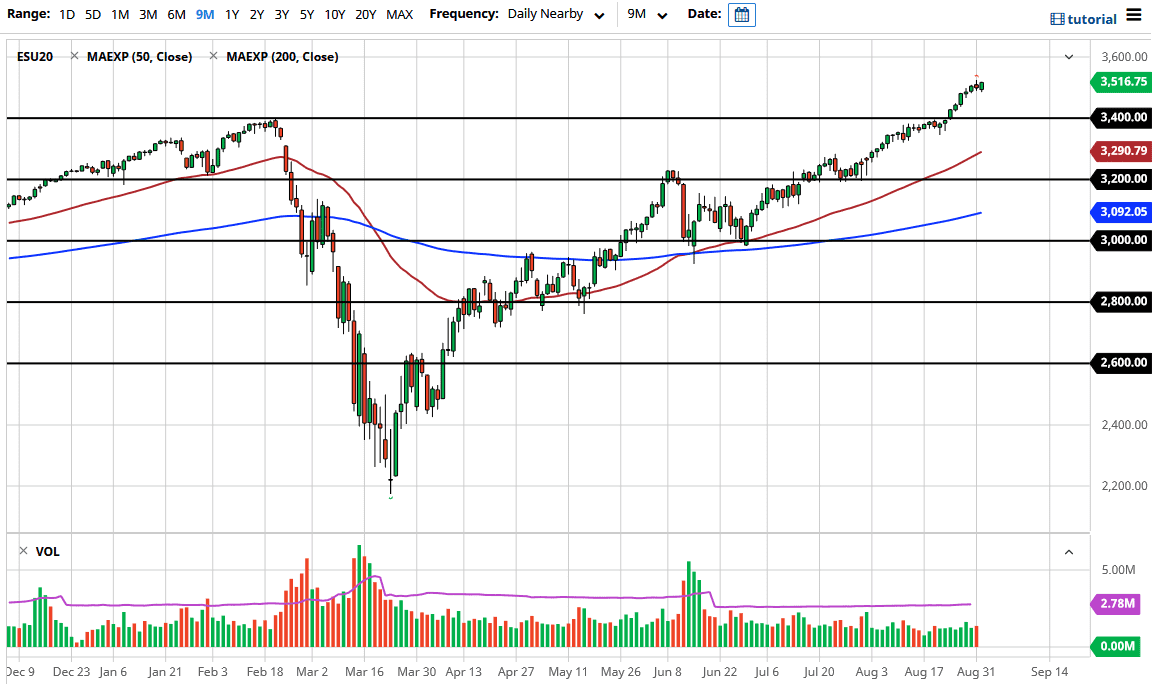
The S&P 500 went back and forth during the trading session on Tuesday, in what has been a very volatile day. Volume was not particularly strong, but at this point in time, it looks as if the market is a “one-way bet” in case you have not been paying attention to what has been going on. Any pullback at this point continues to be a buying opportunity, although we do have the jobs number coming out on Friday which could cause some nervousness.
The Federal Reserve is going to loosen its monetary policy and keep it as loose as humanly possible. In other words, this is a market that I think will continue to attract buyers on dips due to the fact that the purchasing power of currency is getting crushed in general, although the US dollar did recover slightly during the latter part of the day. As long as the Federal Reserve is out there looking to flood the market with US dollars, that should continue to drive liquidity into the stock market, just so it can preserve itself.
The candlestick is rather decent sized, pressing the top of the shooting star from the previous session which should have led to a bigger pullback. That being said, the market is likely to continue to find buyers on dips and I think that the 3400 level underneath is a massive support level. That level was a previous resistance level, so it should now have enough “market memory” built into it to have people coming in to pick up a bit of value. I do believe that eventually we go looking towards the 3600 level, as the market does tend to move in 200 point increments. That being said, the 3500 level is a large, round, psychologically significant “midcentury mark” that a lot of people will be paid attention to. This is a short-term effect though, so given enough time I do think that we sliced through it and continue to go right along our merry way.
Even if we did break down below the 3400 level, then it is likely that we would find buyers at lower levels, including the 3350 handle, the 50 day EMA, and most certainly all the way down at the 3200 level, although I do not expect to get down there anytime soon, and would be quite surprised if it happened.