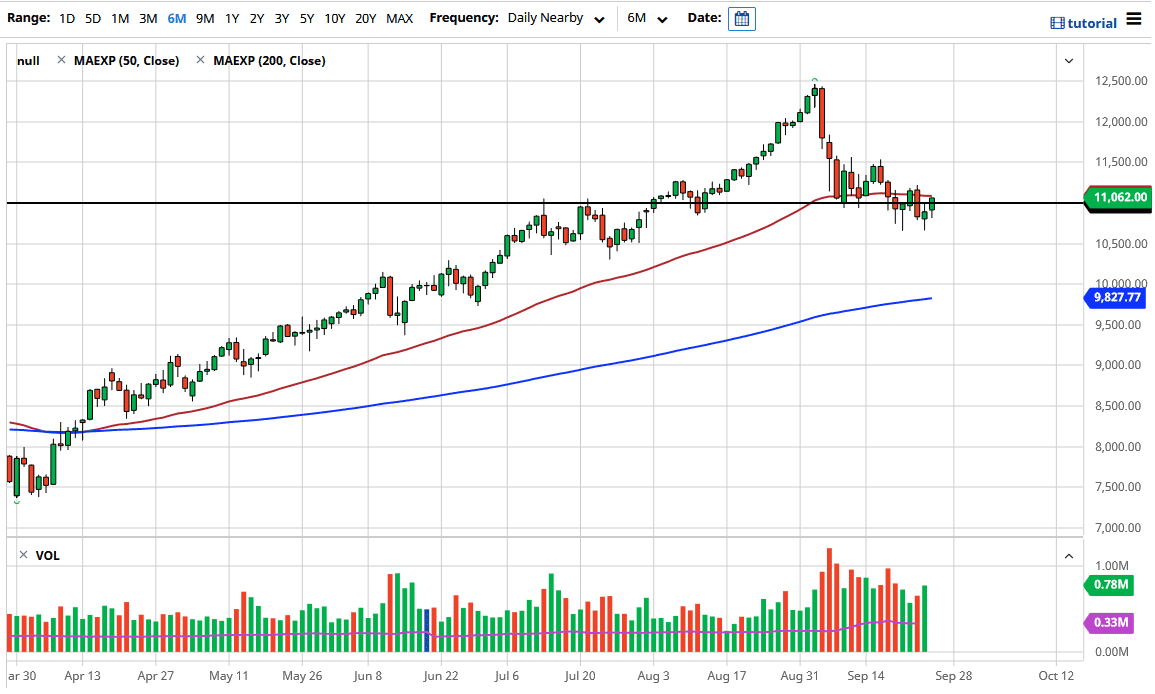
The NASDAQ 100 initially dipped during the trading session on Friday, but then turned around to rally and recapture the 11,000 handle. At this point, the 50 day EMA is being tested, and if we can break above there it is likely that the market will continue to go higher, perhaps reaching towards the 11,500 level. This was a good way to finish the week, which has seen a lot of volatility. Ultimately, if we can finally break above the 11,500 level, then the market is free to go much higher. Looking at all of this noise, it is likely that we will continue to see volatility, but it certainly looks as if the buyers are trying to make a stand right here.
The NASDAQ 100 of course is heavily weighted on just a handful of stocks, including Microsoft, Apple, Alphabet, Facebook, and Netflix. Ultimately, I think that the stocks all attract a lot of attention, and we have been grinding to the upside. If we can break above all of this noise, that is a very strong sign and we should continue to go higher. Keep an eye on the US Dollar Index, as the US dollar strengthens, that works against the value of the NASDAQ 100 and stocks in general. However, it does look like it is trying to calm down a bit, so given enough time we could break above the consolidation and try to go looking towards 12,500 above. On the other hand, if we break down below the lows of the Thursday session, the market is likely to go looking down towards the 10,500 level.
Underneath that level, it looks like the market is going to go looking towards the 10,000 level, where the 200 day EMA currently sits. That of course is something to pay attention to, because the 200 day EMA does seem to attract a lot of technical traders. Furthermore, we are still very much in an uptrend despite the fact that we have seen so much ugly trading as of late. It is a good sign that we are trying to make more of a “rounded bottom” in this general vicinity, but we still have a lot of work to do, meaning that we will probably have a lot of choppy trading. Going forward, I fully anticipate that we will race towards the highs again simply because that is what Wall Street does.