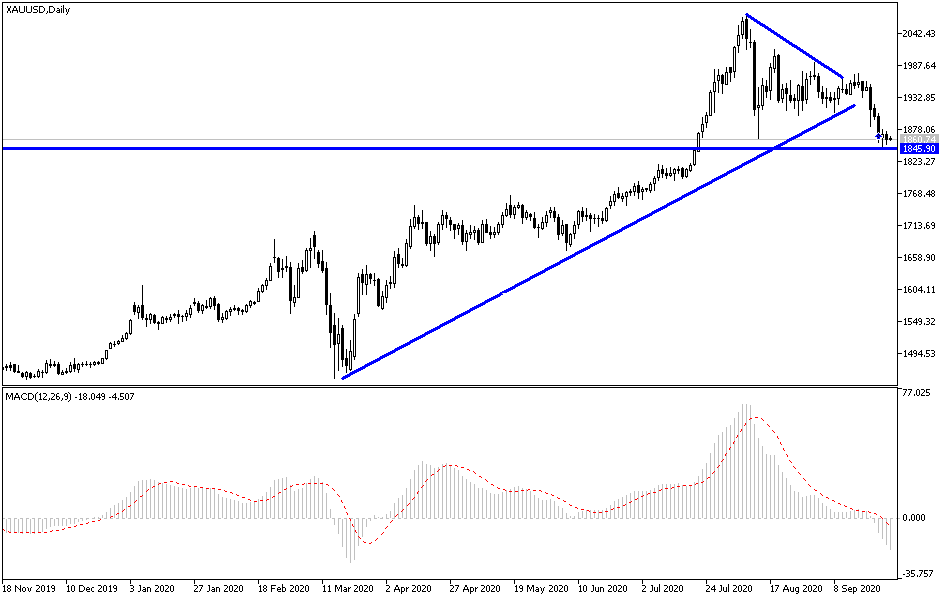
The recent sales of the yellow metal price succeeded in breaking the upward trend of the gold price during last week’s trading, as the price of an ounce of gold plunged to the $1849 support before settling around $1863 per ounce at the time of writing and ahead of important events that strongly affect investor sentiment this week, the most prominent of which is the new Coronavirus outbreak, especially in Europe, which is a global hot spot for the spread of the disease since it was announced at the end of 2019. This is in addition to the reaction from the debate between US President Trump and his rival Biden, the announcement of US job numbers, and the future of the Brexit file, with the results of the eighth and final round of negotiations between the European Union and Britain awaiting. The USD price level will also be important to influence gold prices week.
Gold prices stabilized near their monthly low at $1,849 as the Fed's balance sheet expanded for the second week, reaching its highest levels since June, but it is very likely that gold will not trade higher without stopping the US dollar buying wave. With the announcement of the latest SEP (Summary of Economic Projections) update, the long-term interest rate expectations are unchanged from the June meeting.
It appears that the Federal Open Market Committee (FOMC) will rely on its new tools to support the US economy despite plans to achieve inflation around an average of 2% over time. This could lead to more speculation of additional monetary support to keep gold prices under severe pressure as the rebound from a new high in June largely follows the correction in global stock prices.

Taking a closer look at the future, it appears that the US Federal Reserve is on track to maintain the current policy with the next rate decision slated for the 5th of November. This occurs at a time when the Central Bank announces that it is committed to increasing its holdings of agency mortgage and treasury bonds at the current pace. However, it is not clear yet whether the US central bank officials, along with Jerome Powell, chairman of the board of directors, will continue to drag investors' confidence as he told US lawmakers that the committee remains committed to using their tools and whatever is possible, to make sure the economic recovery continues.
According to the technical analysis of gold: After the recent sales of gold, technical indicators began to give oversold signals, and therefore gold traders may consider making purchases to win from the expected rebound, and accordingly, the support levels at 1853, 1840 and 1825 will be the most appropriate for an exciting buying experience. The factors affecting gold gains on the long term are still present, and what happened recently is normal. There is a correction to take profits and prepare to buy from lower levels for a new breakout. The gold bulls' success in moving prices above $1900 an ounce will spark strong buying again.
The price of gold is trading in a narrower range after falling below the 50-day simple moving average at $1943, for the first time since June. As a result, breaking of $1863, the August low, could indicate a possible change in market direction as the Relative Strength Index is at its lowest level since March. The initial key weekly support is located at 1836, the 38.2% Fibonacci retracement of this year's range supported by 2012 high.
