Every morning this coming week apart from Friday, the US Federal Reserve Chairman, Jerome Powell, will be speaking, and the US Treasury Secretary, Steven Mnuchin, will be speaking on Thursday. Their comments have the potential to affect most major Forex pairs and by extension the US Dollar Index. On Tuesday morning, the Bank of England Governor will be speaking. On Wednesday, New Zealand will be releasing its key interest rate announcement. That same day, France, Germany, and the US will be releasing their Purchasing Managers Index (PMI) numbers – the PMI is a manufacturing number that is a highly monitored indicator of a nation’s economic health. This basket of economic announcements is a great catalyst to provide liquidity and range in the Forex markets for the week of September 21.
US Dollar Index
Let’s begin this week’s outlook with the US Dollar Index.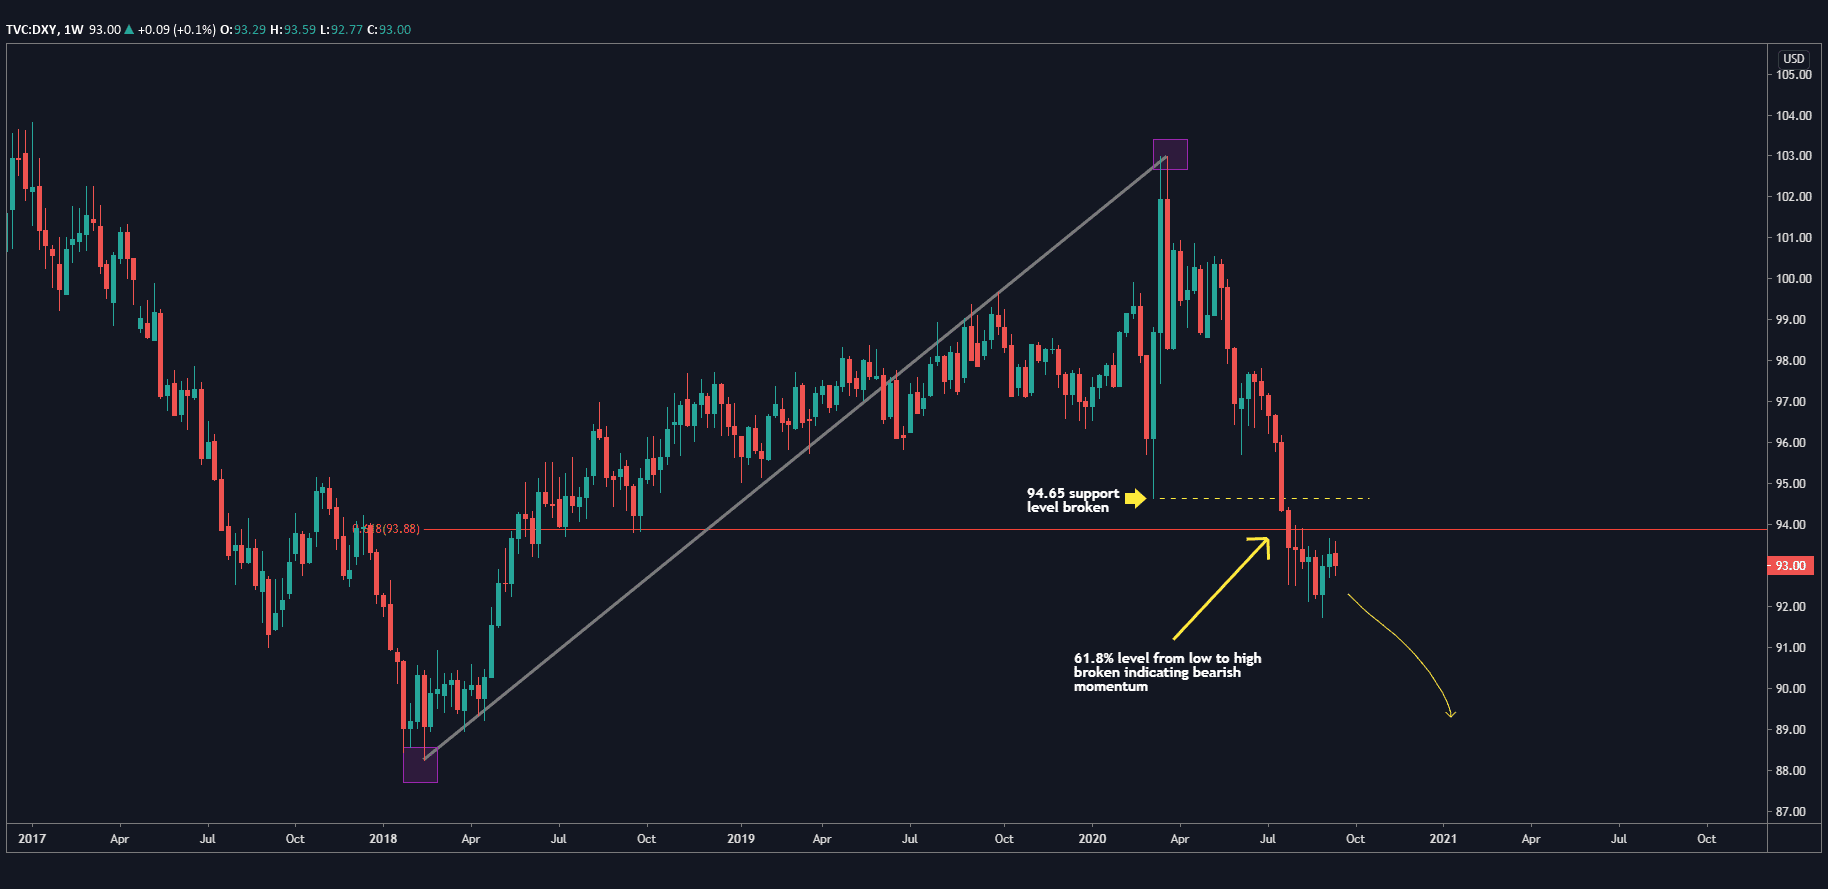 On the weekly chart, it has been bearish since May when it pushed down hard with an impulsive move of consecutive red candles, mainly the result of COVID and the Federal Reserve’s subsequent response to it. The key support level at 94.65 was broken in July and the 61.8% level from the recent major low to major high was also firmly broken in the same month. This leaves the Dollar Index free to move down to the next support level at 88.25. That’s a long way to go!
Let’s zoom into the 4-hour picture.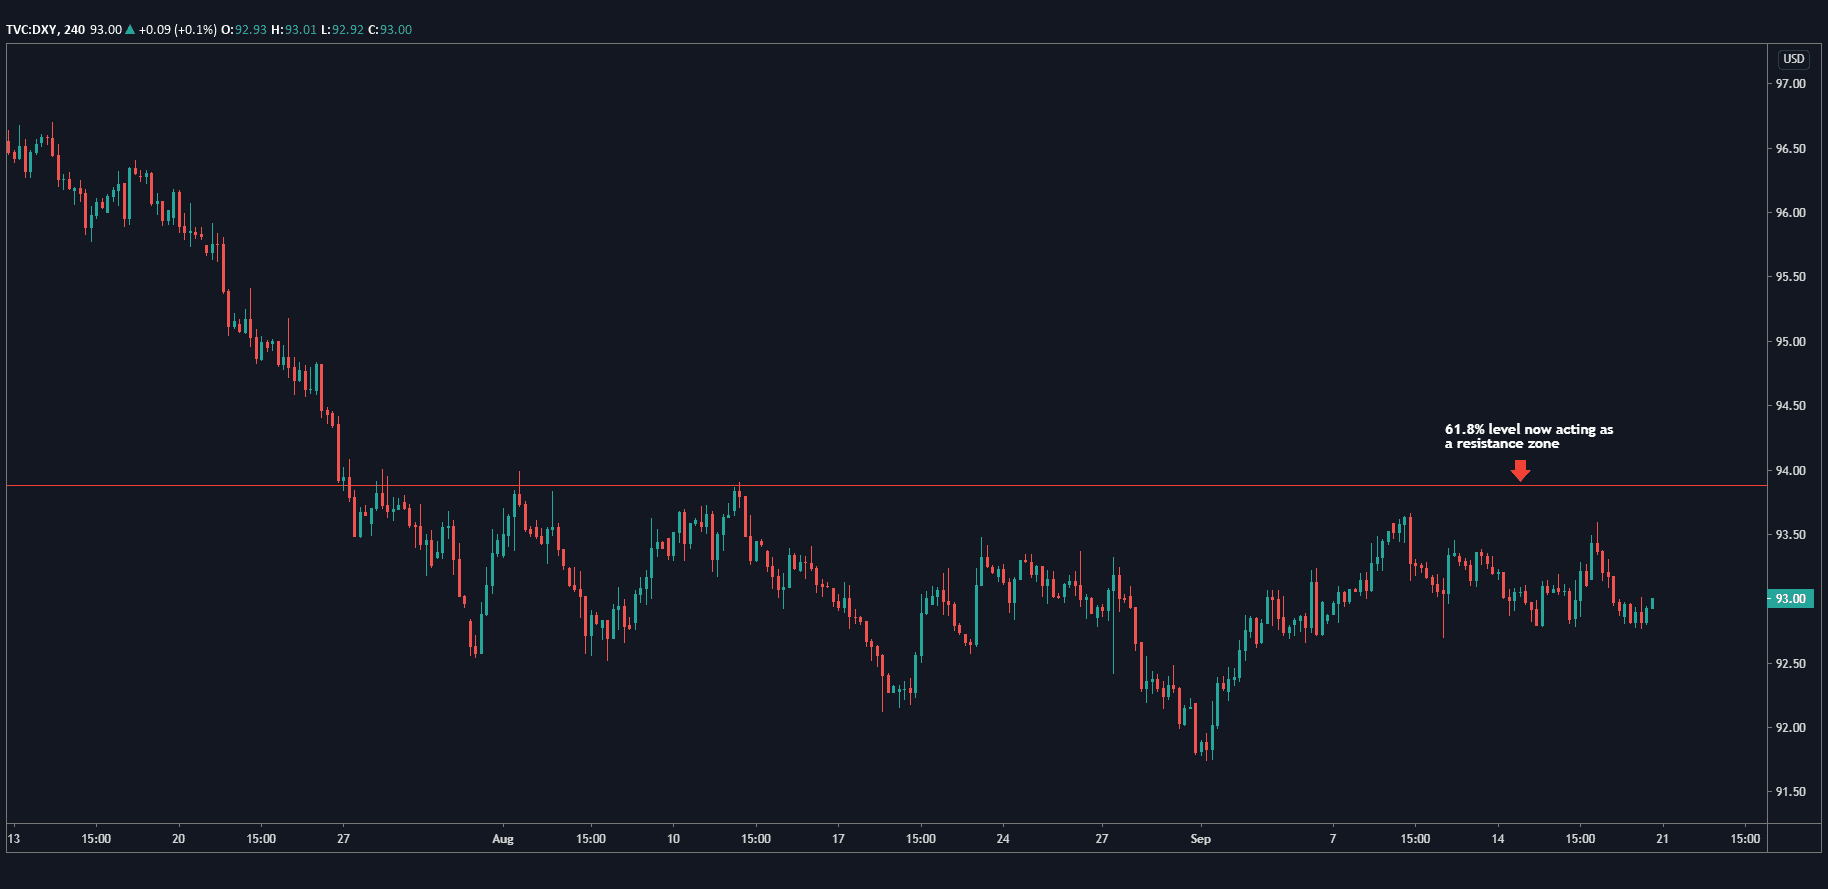 Here we see the 61.8% level we identified on the weekly timeframe now acting as a resistance zone on the 4-hour picture. At the time of writing, the price is near the top half of the range that started in August.
The bottom line: the outlook for the US Dollar Index is bearish with price in a good place to consider bearish trades on either the Dollar Index or using it as a backdrop to finding bearish trades on US-based (i.e. Major) Forex pairs.
USD/JPY
Next, let’s take a look at USD/JPY, first with a weekly chart to gain context.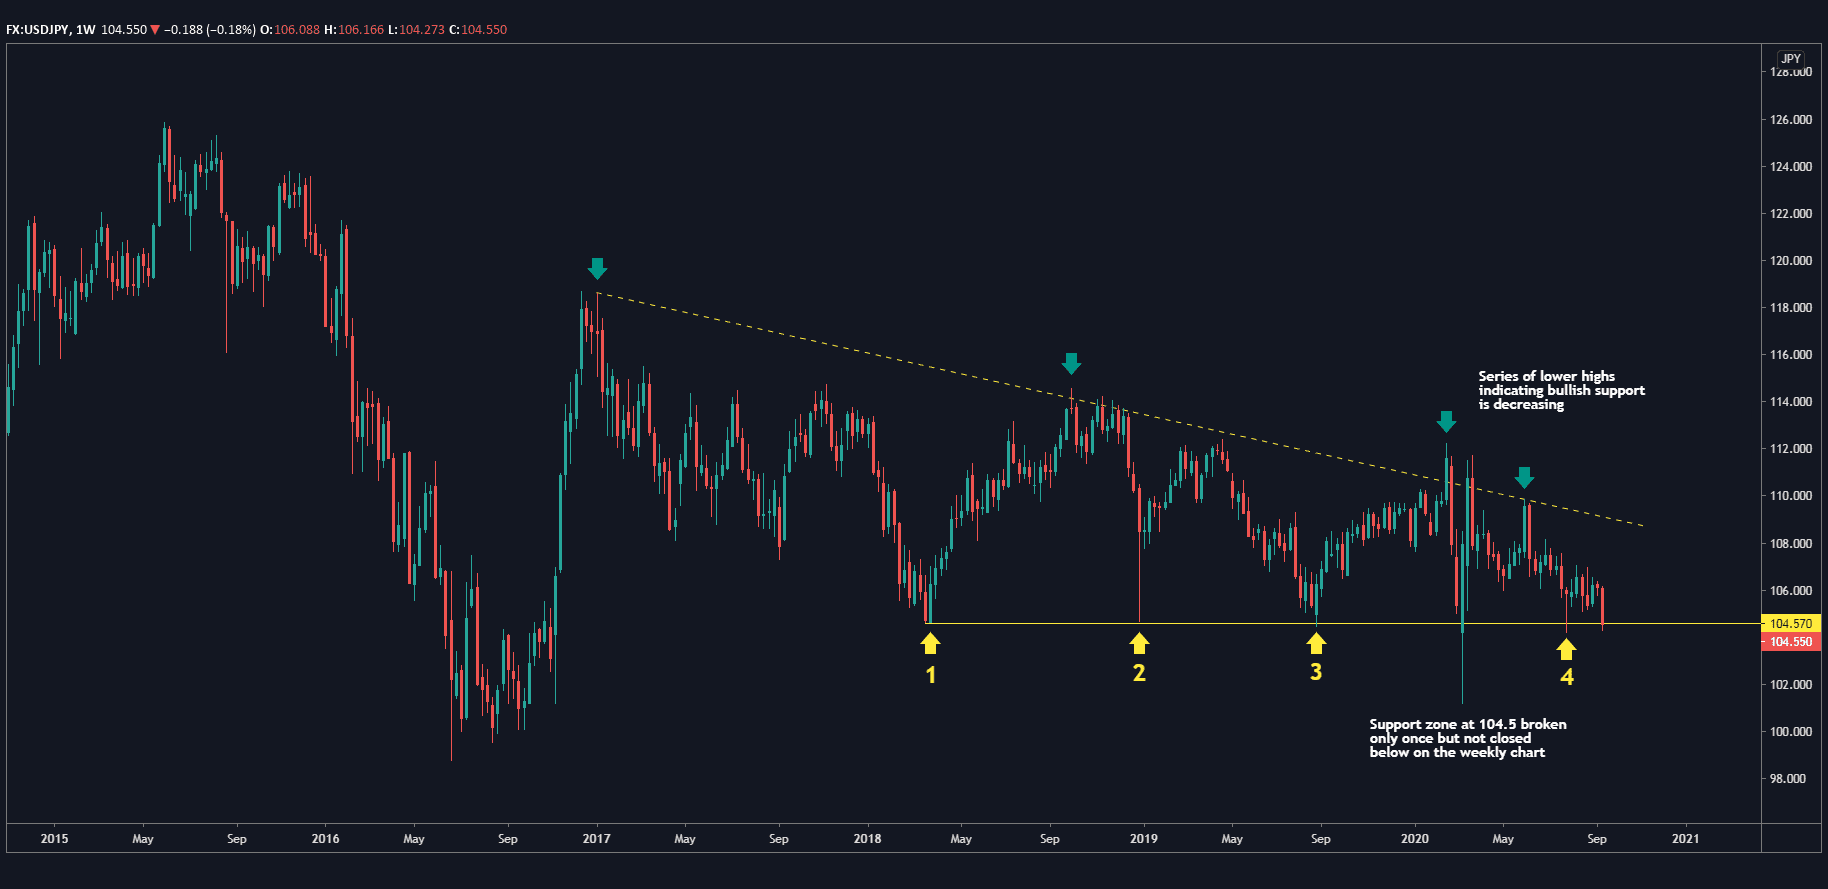 Since 2018, USD/JPY has established a support level around 104.5, breaking it once in early March only to close substantially above it in the same week. If you look at the 4 main bounces against this support level, the first 3 were followed by significant bullish momentum. Even when the support level was broken, the price rebounded quickly and strongly. However, each time the price bounced against this support level, the bullish momentum wasn’t as strong as the previous bounce which in turn created a series of lower highs. Now let’s look at the last test of the support, bounce 4. The price barely moved up and the weak bounce was followed shortly by a long red candle that is now sitting ominously on the support level.
If this week we have 1 or 2 days of daily closes below the 104.5 level (and preferably 104.0 to indicate decisiveness of price action) then a new bearish trend could unfold on the USD/JPY. The next level of support is 100.0, i.e. 400 pips away and a nice round number to take profits!
Gold
Gold is in a super interesting place and worthy of a discussion.
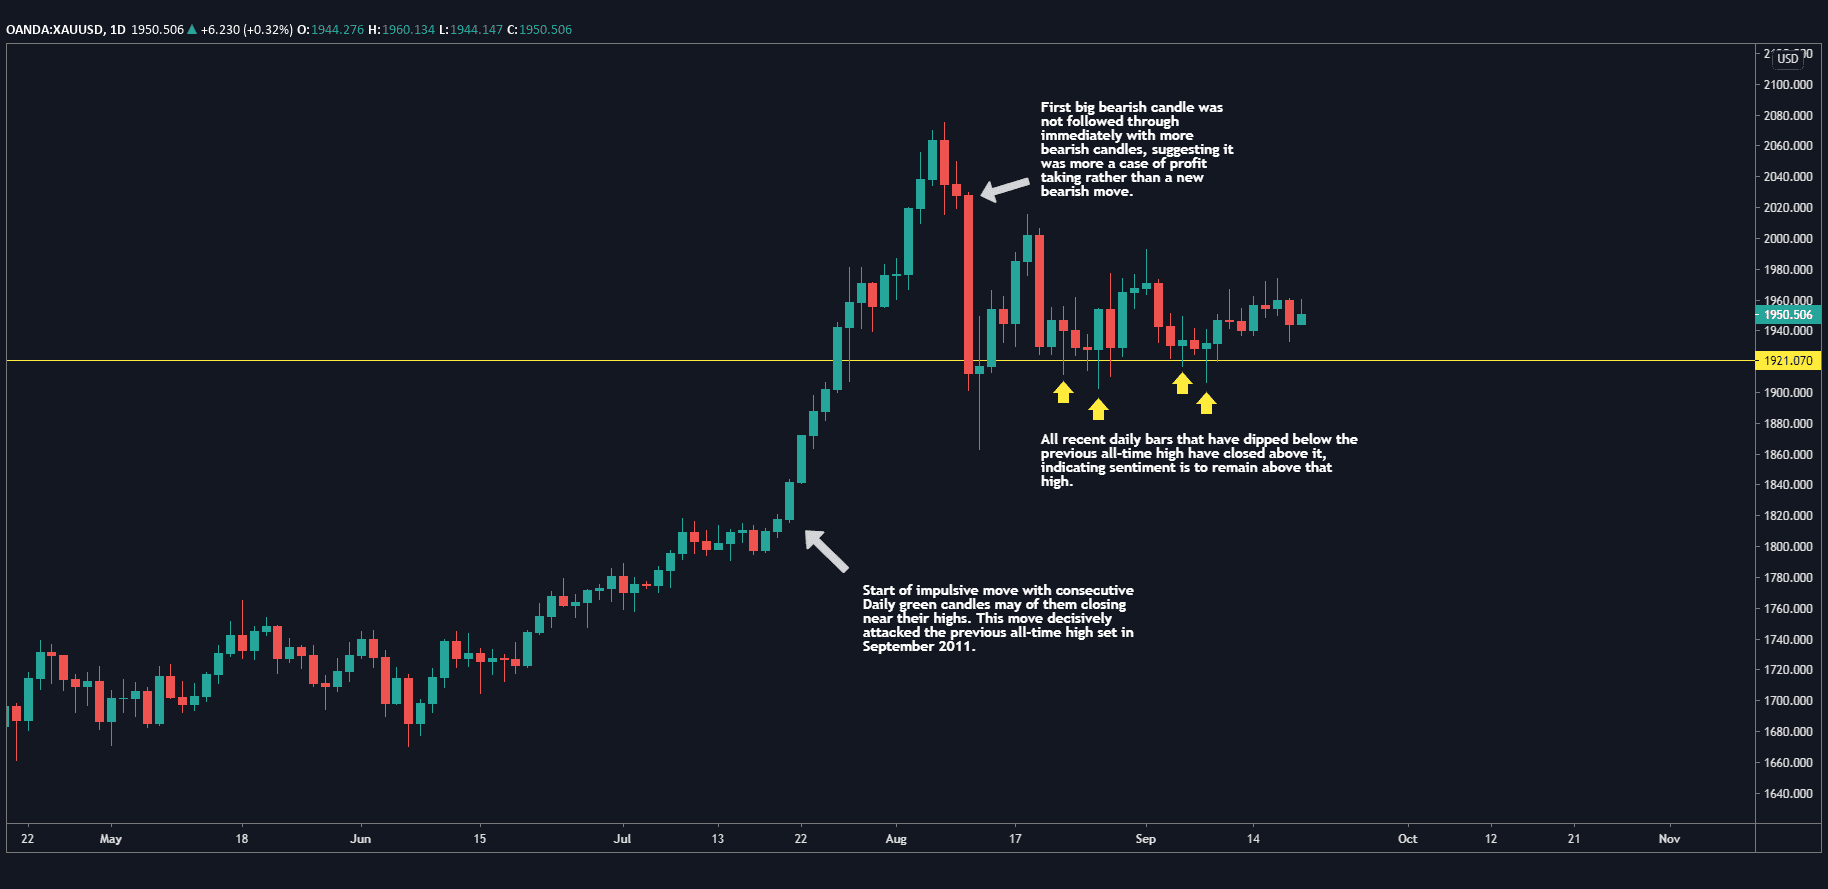
On this Daily chart of Gold, the yellow horizontal line marks the previous all-time high at 1921.07 made in September 2011. The price broke through that high in July of this year with an impulsive move defined by a series of consecutive green candles, many of which closed near their highs. This showed a strong order flow imbalance to the bullish side that pushed price decisively through the previous high. There was a swift pullback with a long red candle on August 11. However, this was not followed through with consecutive bearish candles. This indicates that the pullback was a sign of profit-taking rather than a new bearish trend. This is further reinforced with the fact that in the last few weeks when the price dipped several times below the 1921.07 level, it closed above the level, suggesting a bullish sentiment.
The price is currently in a tight range and experiencing a volatility squeeze. Eventually, it will breakout of the range and the question is whether that will be to the upside or downside.
With the overall bullish picture, we are looking for a break to the upside. Zooming into the 15-minute chart, we see a classic range. A low-risk long entry would be around the 1921.07 area. However, there’s a decent chance the price won’t move down to that level before moving up. A sensible stop-loss area would be around 1880.00. Alternatively, if you want to wait to see some upward momentum again before going long, you could wait until the near-term resistances at 1994.00 or 2015.00 are broken (marked in the rectangles). Of course, those higher entries would need stop-losses at higher price levels to maintain good reward/risk ratios for your trades.
If I observed a couple of Daily bars that close below 1921.07, that would make me reconsider my bullish bias.
EUR/USD
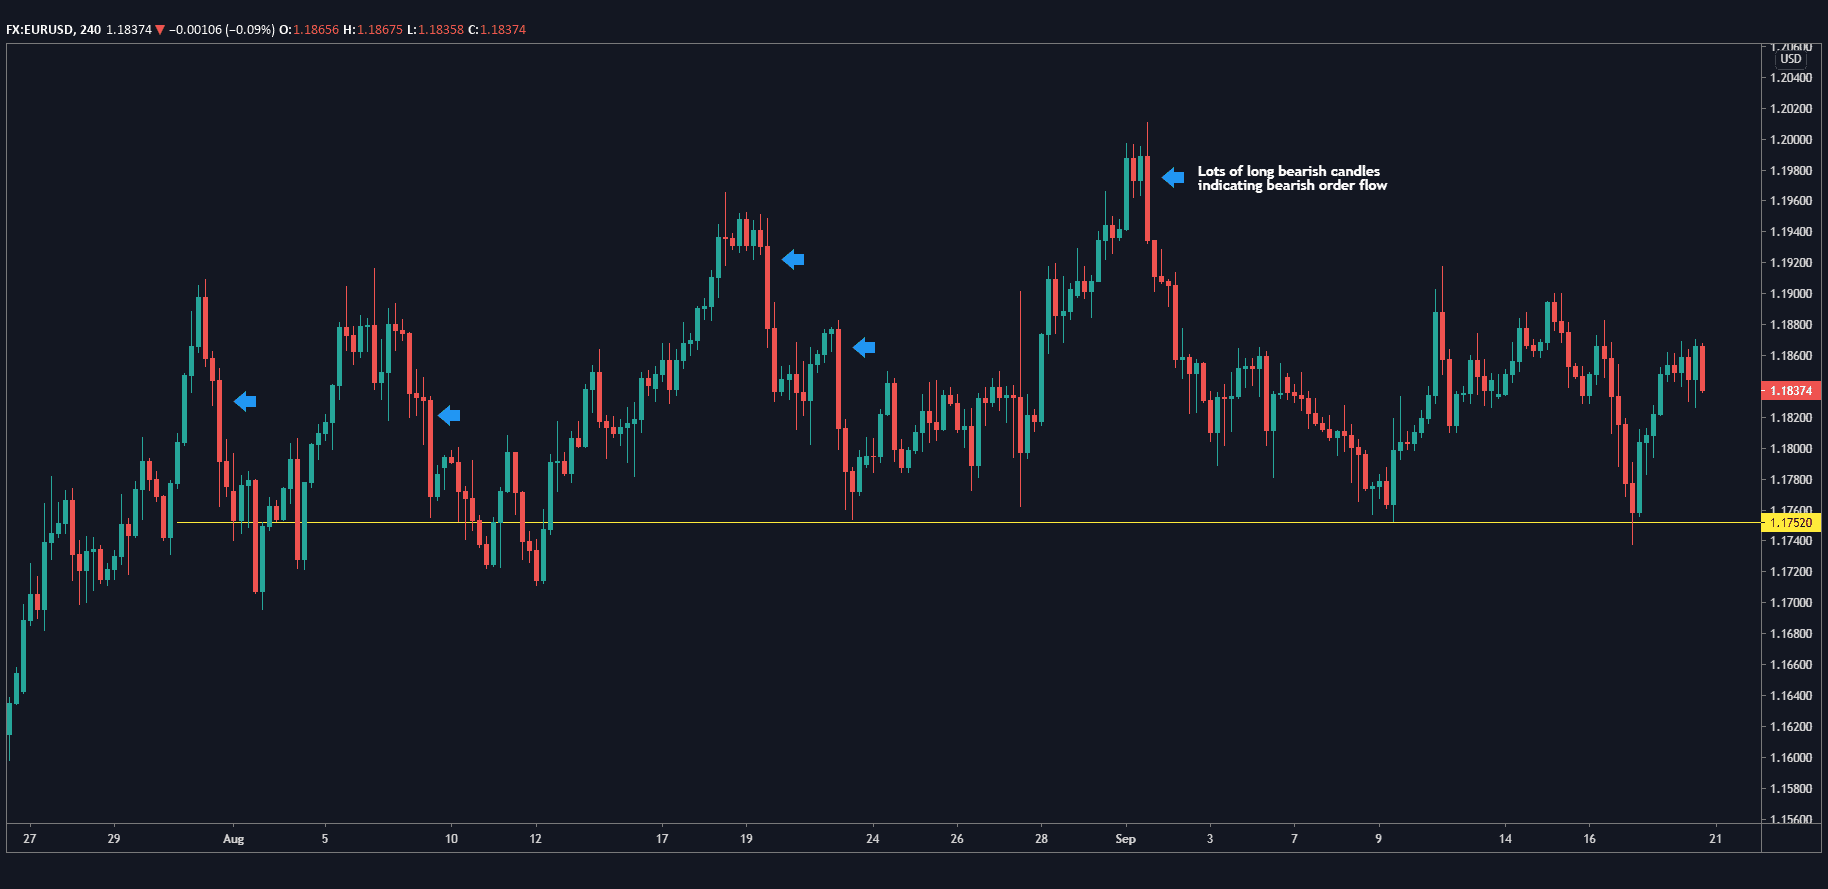
Lastly, let’s round-up this week’s analysis by looking at the biggest Forex pair of them all, EUR/USD. Given we have a bearish Dollar Index picture, we’d expect a bullish EUR/USD picture, but it is not all that clear.
The 4-hour chart shows that EUR/USD is in the middle of a range with support around 1.1752. Even though a support level has been established, whenever the price moves up in the range, the price is pushed back down much quicker than it takes to rise in the range – you can see this by spotting the long red candles that are part of the range, with fewer long green candles. This suggests a bearish order flow or sentiment bias.
The bottom line: currently EUR/USD doesn’t have a clear picture in play but with the US Federal Reserve speaking through the week and the various PMI numbers being released from Europe and the US, by Wednesday or Thursday we could see a tradeable trend developing out of that range.
Always, always control your risk. Consider a trade in the context of its risk relative to the potential reward. Find entry points where the stop-loss is at least smaller than your first target.

