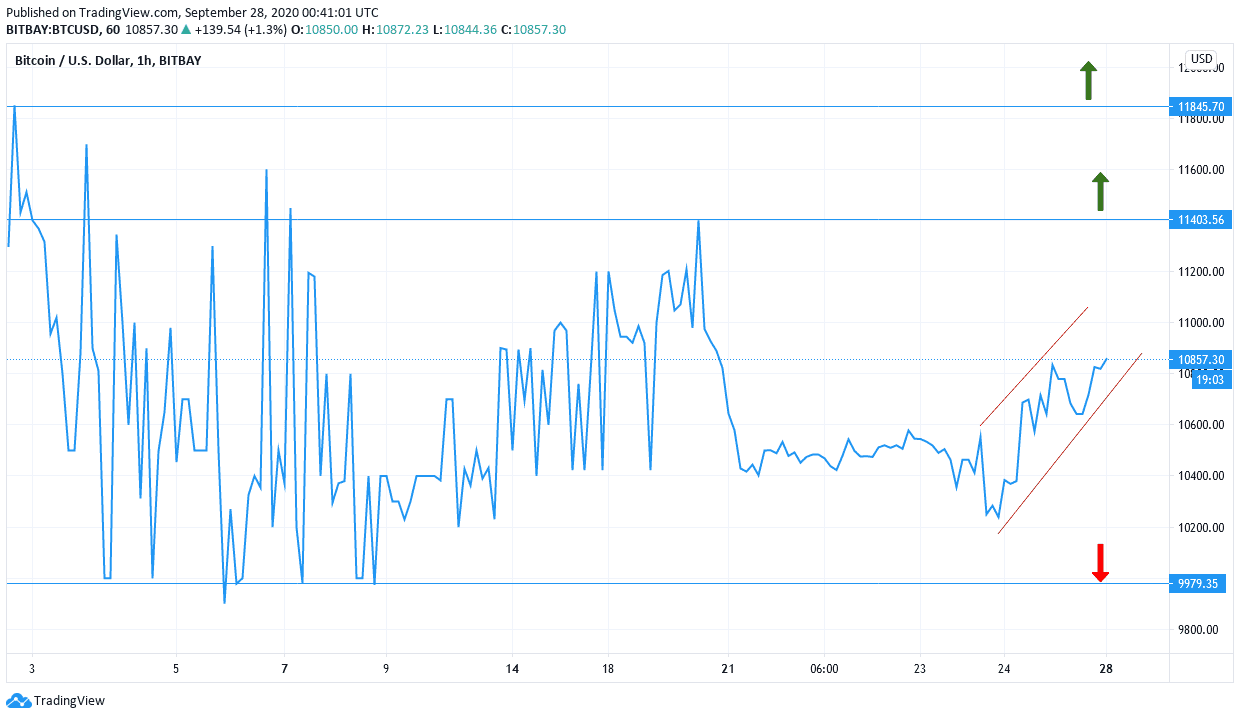
Today's signals for the BTC/USD pair
- Risk 0.75%
- Trades must be taken before 17:00 Tokyo time today only.
Buy trading ideas:
- Buying position after the bullish price action reversal on the H1 timeframe, immediately after the next touch of 11800 or 11100.
- Place stop losses at one point below the local swing low.
- Move your stop loss to break even when the trade is in 200 dollars of profit.
- Take 50% of the position as profit when the trade is in 200 dollars of profit and allow the remainder of the position to run.
Sell Trading Ideas:
- Sell position after bearish price action reversal on the H1 timeframe immediately upon the next touch of 10000.
- Stop losses at one point above the local swing high.
- Move your stop loss to break even when the trade is in 200 dollars of profit.
- Take 50% of the position as profit when the trade is in 200 dollars of profit and allow the remainder of the position to run.
The best way to define a "price action reversal" is for an hourly candle, such as a pin, Doji, outside, or even a vertical candle, to close higher. You can take advantage of these levels or areas by observing the price action that occurs at these levels.
BTC/USD Analysis
The BTC/USD pair is facing strong selling amid the strength of the US currency, and there will be a real threat to the bulls' control in the event that the pair moves towards the $10,000 support and stabilizes below it, and amid quiet transactions, the pair is trading between 10872 and 10820. On Thursday, Bitcoin price rebounded from its current 10-day lows at around $10133, rising to $10.765. Bitcoin fell last week on sell-off after reaching as high as $11,153.
From an economic perspective, bitcoin is trading amid a reaction to the many speeches from members of the US Federal Reserve Committee, and the testimony of Jerome Powell, US Central Governor, before the House Financial Services Committee. Powell appears to be indicating that the US banking sector is more stable than it appears after a drop in individual loans of $1 million or less. Overall, Bitcoin continues to face high volatility, making it less ideal for a safe-haven investment.
Technically: In the near term, the BTC/USD price seems to have recovered by more than 50% after last week's decline. The BTC/USD is now trading above the 50% Fibonacci level on the hourly chart. This indicates the bulls are trying to dominate the market on the short term. Accordingly, bulls will target short-term gains at around 61.80% and 76.40% Fibonacci at $10762 and $10915 respectively. On the other hand, bears will target gains at around 38.20% and 23.60% retracement levels at $10,524 and $10,372 respectively.
In the long term and judging by the performance on the daily chart, it appears that the BTC/USD pair has retreated significantly from its current 14-month highs. Bitcoin reached its highest level at $12,542 in mid-August before retreating to trade at the current level around $10,644. Accordingly, bulls will target long-term gains around $12,542 or higher around $14,059. On the other hand, bears will be looking to jump on gains at around $8,909 or less at $7,198.

This chart is from the TradingView platform
The uptrend of the BTC/USD is now in danger of facing further challenges if the US dollar shows more strength signs``. Amidst the absence of economic data and important events today, the performance of the pair will interact more with investor sentiment.
