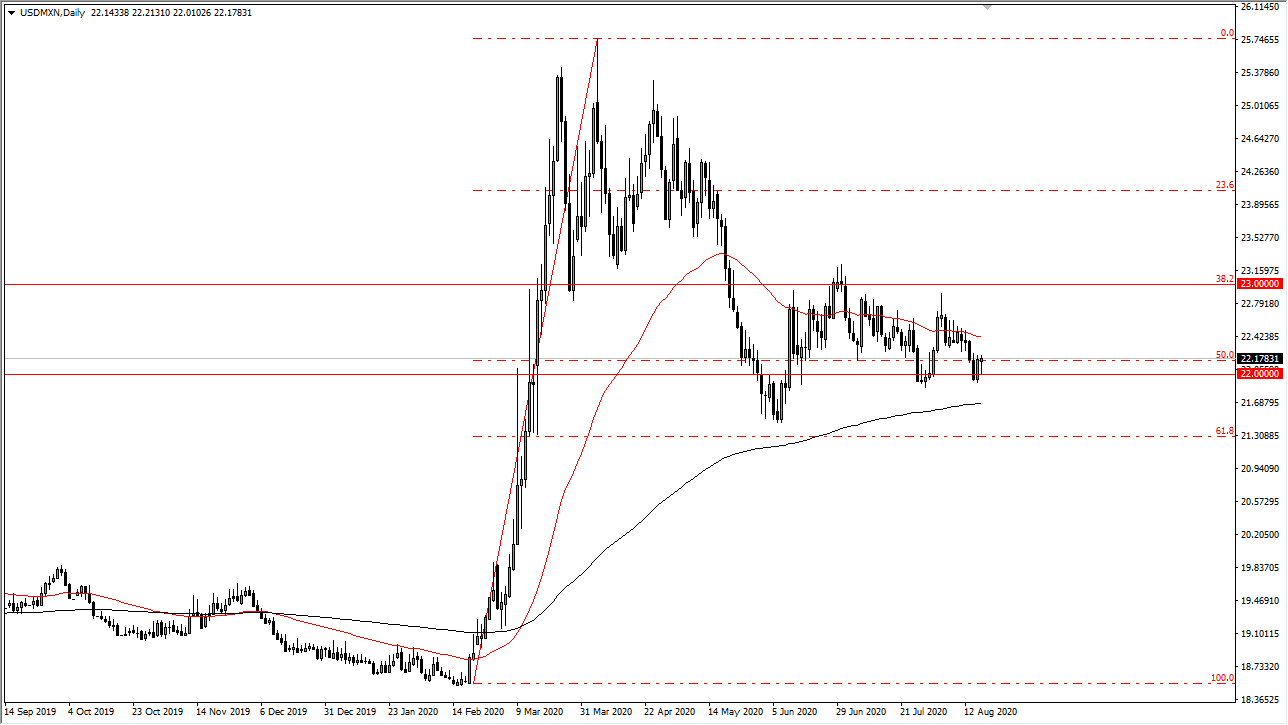
The US dollar initially fell against the Mexican peso during the trading session on Tuesday, reaching down towards the 22 MXN level. However, we have seen the market turn right back around to form a bit of a hammer, which is noteworthy due to the fact that it is a large, round, psychologically significant figure and is an area that has shown a bit of support as of late. With that being the case, I think we are likely to see a little bit of a bounce, which is a particularly interesting sign due to the fact that the US dollar got crushed against most other currencies during the day. At this point, I think this tells us more about the Mexican peso than anything else.
If on a day that both the Euro and the British pound broke out against the US dollar, and the Mexican peso fell, then tells you that the Mexican peso has a lot of negativity around it. Granted, it is only a single day, but at this point in time, the fact that we could not break down below the crucial 22 level tells me that we have a lot of buyers in that area of the greenback. Furthermore, the pair could be telling us that emerging market currencies themselves are going to be a bit of trouble as people worry about monetary policies around the world expanding, and coronavirus figures in places like Mexico and Latin America which seem to be still rather negative.
The 50% Fibonacci retracement level is right in the same neighborhood, and we have the 200 day EMA reaching higher. However, at the same time we have the 50 day EMA pushing lower just above and therefore showing signs of potential resistance. I think we are simply going to continue to bang around in this area, but maybe with more of an upward attitude over the next couple of days. Eventually, we should get some type of impulsive candlestick in one direction or the other that we can follow, but right now we would need to see something rather impressive. In the short term, I believe that the market looks tight, perhaps bouncing around between 22 on the bottom and 22.75 above. Expect noisy trading, but if we do break above the 23 level, then it is time to start buying. At that point, it opens up the possibility of a much bigger move. On the other hand, if we break down below the 200 day EMA, then it is likely we could go much lower, perhaps down to the 20 area.