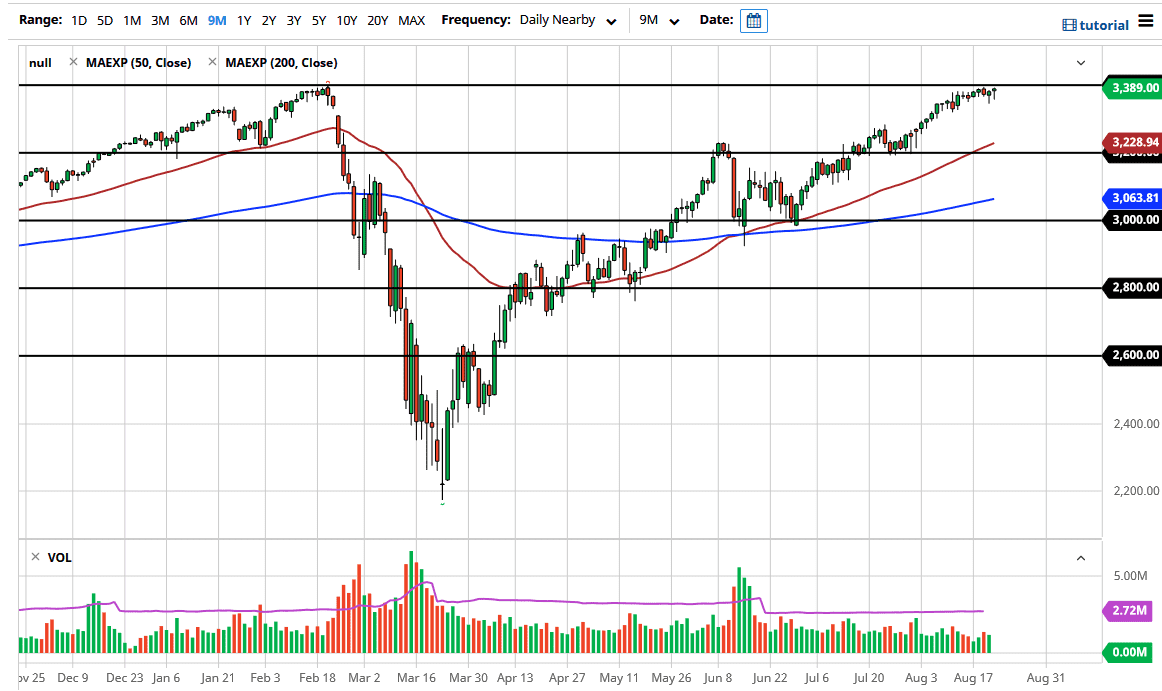
The S&P 500 initially pulled back during the trading session on Friday, as the US dollar rallied rather significantly. By doing so, the market looks as if it is trying to get towards the three 400 level, the all-time high that we had recently put in the marketplace. If we can break above, there then it is likely that the S&P 500 will continue to extend gains towards the 3500 level.
As far as pullbacks are concerned, then I think that they will happen, and there should be plenty of buyers underneath. However, they get a little bit of momentum to the downside and we could go looking towards the 3350 handle, perhaps even the 3300 level after that. If that level gives way, then we would be looking at the 50 day EMA and then finally the 3200 level. What I find interesting about the 3200 level is that it has previously been support and resistance, so it would be a bit of a retest of a breakout. Furthermore, the 50 day EMA is just above there so that is yet another reason to think that people would be interested.
It does make sense that we struggle to break out after recovering the way we have, and a lot of traders who were on the verge of been wiped out after the coronavirus break down are more than likely to be willing to cover their positions at these high levels, in order to make themselves whole again. The shape of the candlestick is a hammer, which is preceded by a hammer. Because of this, it looks like there is a lot of buying pressure underneath so I like buying dips on short-term charts but I do recognize that there was levels underneath our things to be aware of in the back of your mind as they give you an opportunity to pick up value if we get down there.
I think that once we get to the 3500 level it could be psychologically resistant, so it may take some time to get above there. That being said, it does make sense that a big number like that would be a bit of a magnet for price, so do not be surprised at all to see if we break out towards that area. As long as the Federal Reserve is flooding the markets, I anticipate that we go higher.