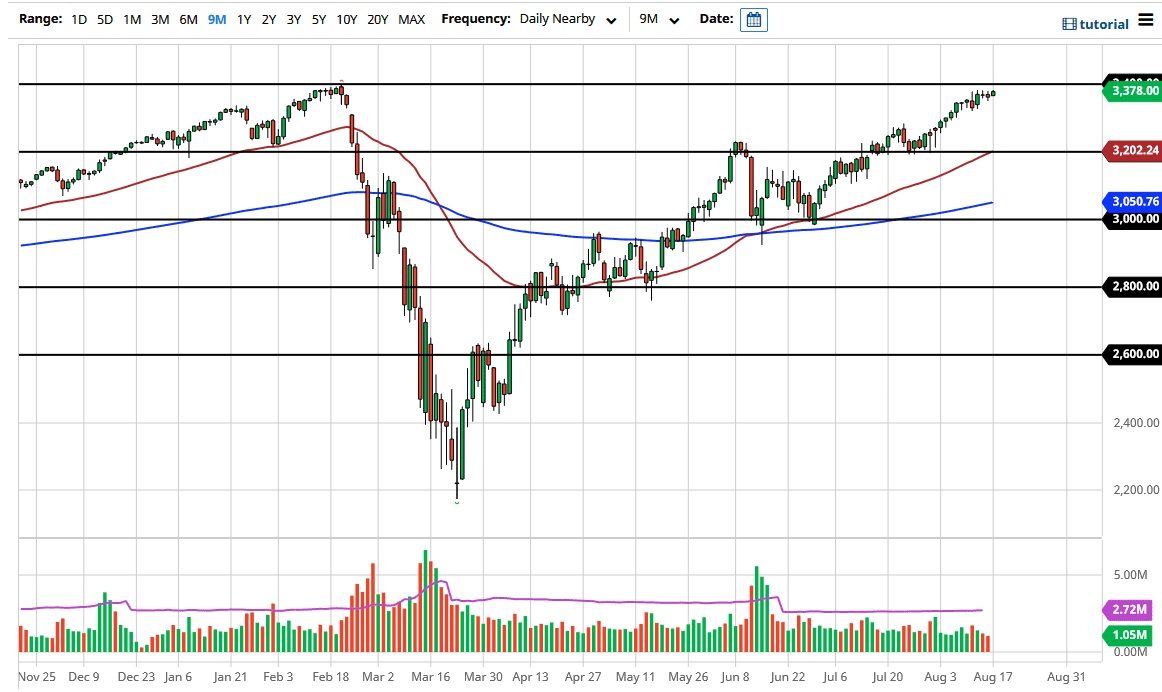
The S&P 500 continues to look bullish, although it is settling down a bit just before attacking the all-time highs. At this point, it is only a matter of time before we get the breakout that will send this market much higher. Ultimately, I think that buying on the dips continues to work although we may have to “tread water” in the meantime in order to take advantage of what is such a strong trend. We may have to burn off some of the excesses but ultimately at this point in time I look at pullbacks as an opportunity to take advantage of the market when it becomes a bit “cheap.”
Underneath, I see multiple areas that could be thought of as potential support levels, as the 3350 level will be the initial one, followed by the 3300 level. Looking at this chart, I also recognize that there is a massive amount of support near the 3200 level as it was massive support a couple of weeks ago, and it also features the 50 day EMA now. Between all of that, it is likely that the market will continue to see buyers on dips towards that level. If we were to break down below it, that would obviously change a lot of things but even then, I do not consider that a selling opportunity.
I think it is only a matter of time before we break above the 3400 level and when we do it will send this market looking towards the 3500 level above. That is a large, round, psychologically significant figure, and it is an area where we would find a lot of potential profit-takings. For what it is worth, several of the large banks on Wall Street have increased their estimates, and therefore a lot of the typical Wall Street traders will be looking to buy this market. If we do break down below the 3200 level, then the next obvious support level will be right around the 200 day EMA, perhaps even the 3000 level. It is not until we break down below the 3000 level that I would become truly concerned with the overall trend. At that point, there will have been some type of major shift in the economic outlook and the overall attitude of traders around the world. Until then, buying dips continues to be the best play.