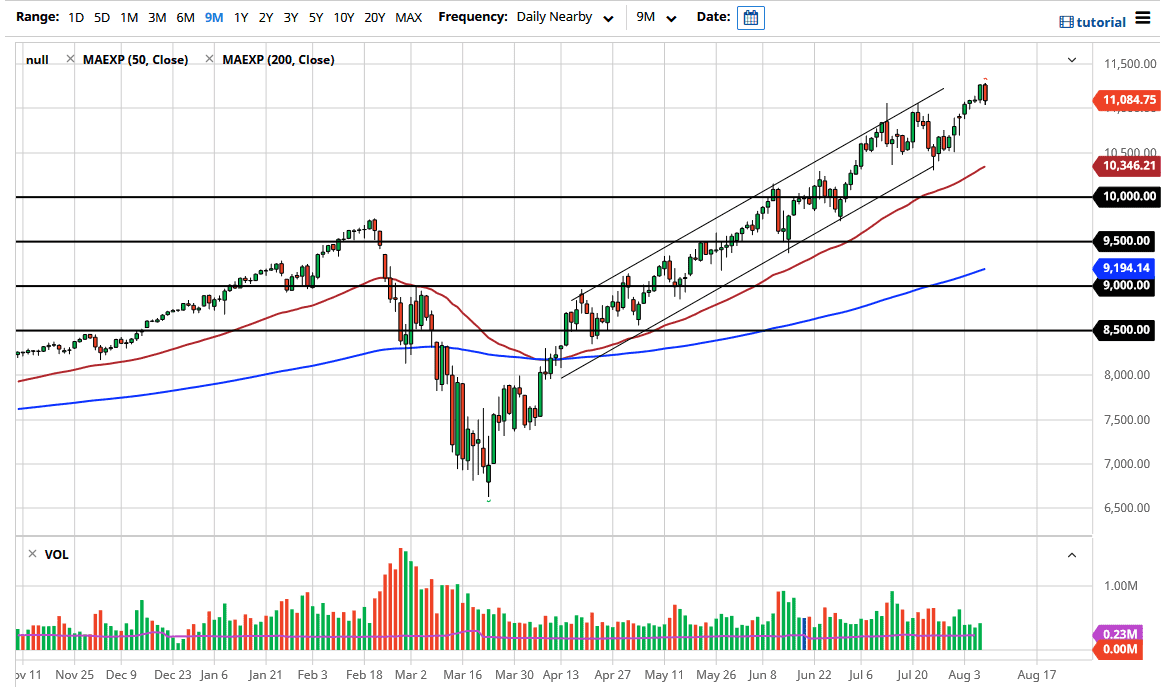
The NASDAQ 100 has pulled back a bit during the trading session on Friday after the Non-Farm Payroll number came out. By pulling back the way it has, the market looks likely to have shown a bit of an overextension as the NASDAQ 100 reached the top of the channel. At this point in time, the market has then pulled back towards the 11,000 level, and I think it is only a matter of time before the 11,000 level gets tested as support. If we break down below that level, the market will then probably go down towards the 10,750 level, possibly even the 10,500 level.
If the 11,000 level holds as support, then we will shoot back towards the highs, perhaps even the 11,500 level. I like the idea of buying short-term pullbacks, as it offers value in a market that is so obviously bullish. However, you should keep in mind that the NASDAQ 100 is moving essentially on the idea of liquidity more than anything else. The other major issue is the fact that there are a handful of technology companies that are driving everything forward in the “stay-at-home economy.” For example, the usual suspects are roughly 33% of the market.
Those companies include Apple, Microsoft, Alphabet, Facebook, and Amazon. Everybody buys those stock sooner or later, so it makes quite a bit of sense that we continue to see buyers push this index higher. Remember, this market is not weighted equally, so most of the time it really does not matter what the bottom 90 stocks do. It is a little bit of a simplification, but if you stick by the rules of paying attention to that handful of stocks, you should do quite well. Furthermore, the US dollar falls as it continues to push this market higher as well. Ultimately, we are in a channel that should continue to offer plenty of support, and the 50 day EMA underneath is approaching the 10,500 level as well, offering even more support. The negative candlestick that formed for the Friday session does show signs of exhaustion, and we should welcome that exhaustion. A pullback should offer plenty of value for traders who are patient enough to wait for, so I would say to look for some type of supportive daily candlestick in order to get involved.