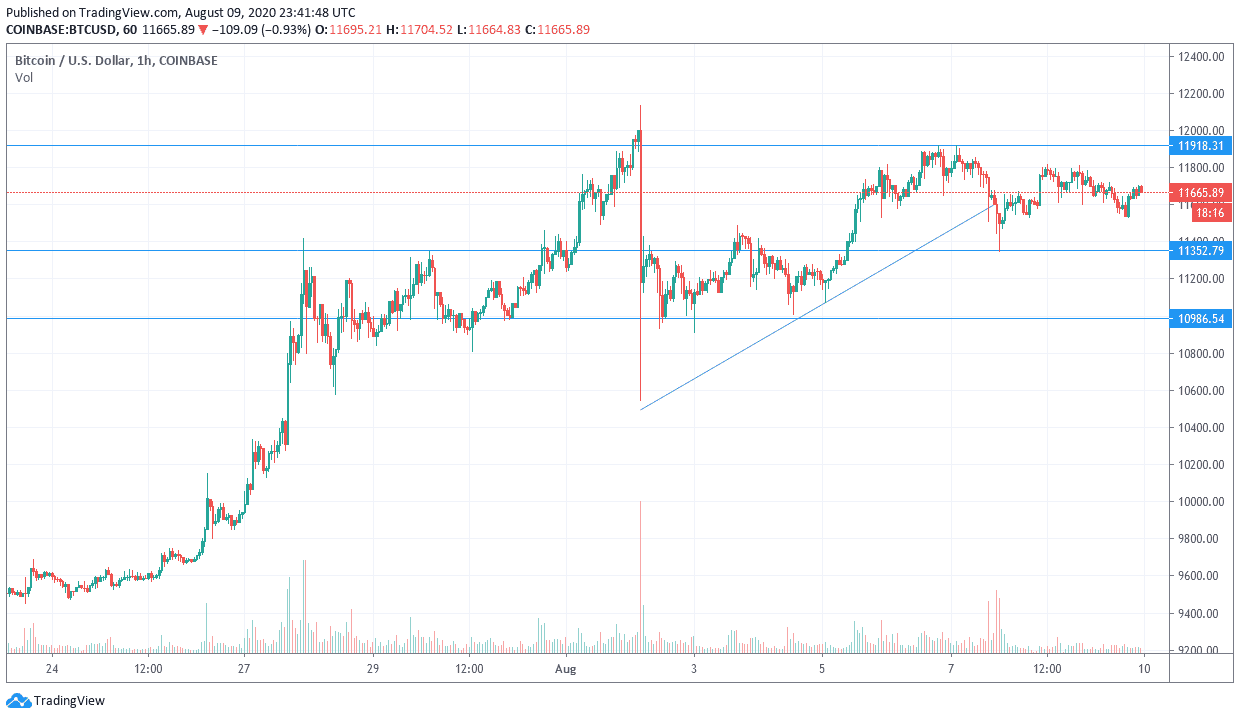
Bitcoin/USD: Amid the resumption of the USD strength.
Today’s BTC/USD Signals
- Risk 0.50% per trade.
- Trades may only be entered prior to 5 pm Tokyo today.
Long Trade Ideas
- Long entry after a bullish price action reversal on the H1 time frame following the next touch of $10500 or $11200.
- Place the stop loss $50 below the local swing low.
- Move the stop loss to break even once the trade is $50 in profit by price.
- Remove 50% of the position as profit when the trade is $50 in profit by price and leave the remainder of the position to run.
Short Trade Ideas
- Short entry at the next touch of $14,000.
- Place the stop loss $50 above the local swing high.
- Move the stop loss to break even once the trade is $50 in profit by price.
- Remove 50% of the position as profit when the trade is $50 in profit by price and leave the remainder of the position to run.
The best method to identify a classic “price action reversal” is for an hourly candle to close, such as a pin bar, a doji, an outside or even just an engulfing candle with a higher close. You can exploit these levels or zones by watching the price action that occurs at the given levels.
Bitcoin/USD Analysis
I mentioned in the recent technical analysis of the BTC/USD pair, that technical indicators indicate that gains have reached overbought areas and is awaiting a downward correction down at any time. At the time of writing, the pair is stabilizing around the $11660 level. On Friday, the BTC/USD retreated from weekly highs around $11931. The correction was supported by the positive US non-farm payrolls figures for July.
The pair rose last week to trade above 76.40% Fibonacci level, before retreating on Friday to trade near it. There are still several levels above the 61.80% Fibonacci level and the 100-hour simple moving average. Friday's decline pushed it away from the overbought levels of the 14-hour RSI on the hourly chart.
Bitcoin, the world's first cryptocurrency, has benefited greatly from the economic meltdown caused by COVID-19. Global markets experienced negative impacts amid lockdowns and restrictions on travel and business activity. Bitcoin has quickly become a safe investment for cryptocurrency enthusiasts, and this has increased its gains over the past four months. The halving of Bitcoin that occurred a few months ago also played its role in making the leading cryptocurrency more scarce compared to fiat currencies like the US dollar.
On the other hand, the US dollar received short-term support on Friday after the latest round of US nonfarm payrolls. The jobs market in the United States created 1.763 million jobs in July, compared to an expectation of 1.6 million jobs. Average hourly wages grew 4.8% (year over year) against expectations of 4.2%, while the current unemployment rate was 10.2% better than the expected rate of 10.5%. The US labor force participation rate for this month also beat expectations at 61.1% with a reading of 61.4%.
On the longer term, and based on the performance on the daily chart, it appears that the BTC/USD pair has increased recently after forming a reinforced triangle. Bitcoin now faces strong trendline resistance just below the $12,000 level. It remains in the overbought territory of the 14-day RSI. Accordingly, the bulls will look to extend the current long-term gains towards $12,821 or higher to $13,894. On the other hand, bears will be targeting long-term downturn profits at around $10,730 or less at $9,414.
Regarding the US dollar, JOLTS numbers will be announced.

