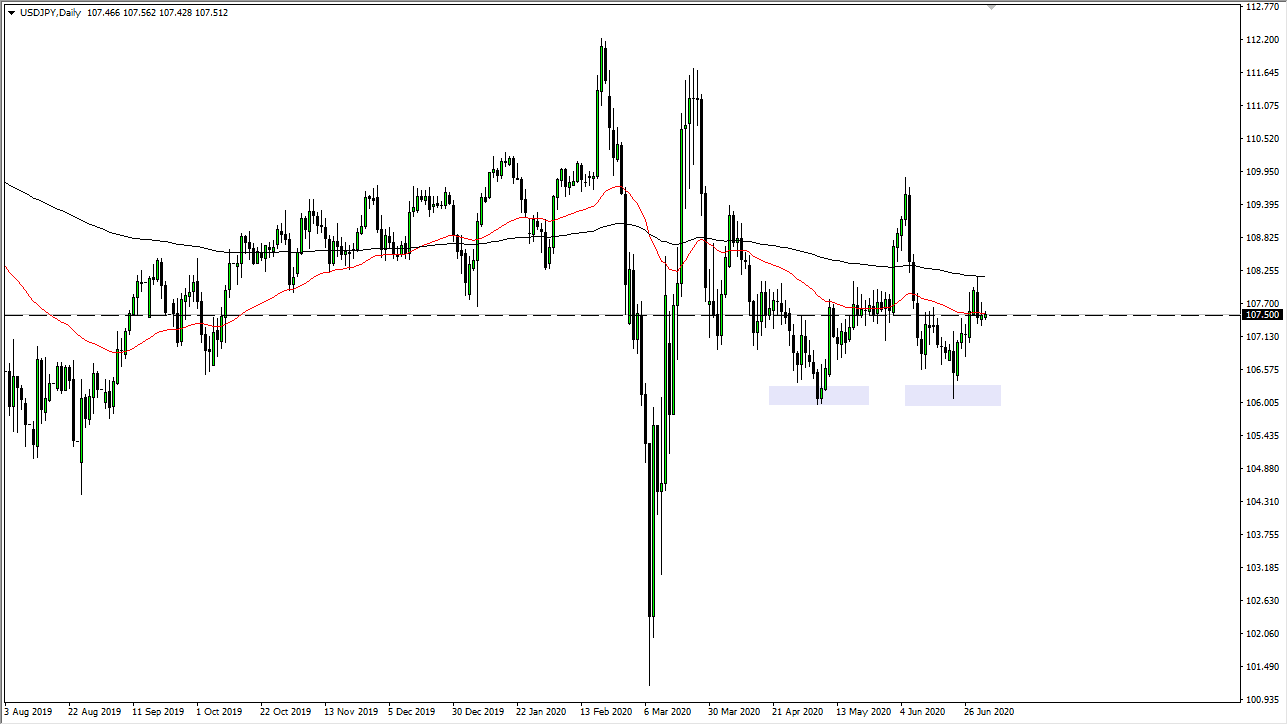
The US dollar did rally a little during the trading session on Friday as we had the Americans observing the Independence Day holiday on Friday, meaning that a lot of the liquidity simply was not there. If that is the case, then the fact that the candlestick is so small for the Friday session should not be much of a surprise. Furthermore, the ¥107.50 level is an area that has attracted a lot of attention. It is essentially “fair value” in the market, as we continue to go back and forth from this area. Any time we get close to a 100 PIP move away from that level, it seems like buyers or sellers come back to push it right back there. In that sense, it is a bit like a Bollinger Band indicator.
The 200 day EMA has offered resistance recently, just as the 50 day EMA is now offering both support and resistance. Ultimately, this is a market that I think is going to continue to chop around sideways, so I am using this chart as a way to measure either Japanese yen strength or weakness, and perhaps translate that into other markets.
When you look at the 50 day EMA and the 200 day EMA, they are both relatively flat with just the slightest of angles to the downside. Furthermore, when you stretch out much further, you can see that we are in a major symmetrical triangle, and that means that we will eventually have some type of major move. However, we are nowhere near that right now, so I think this is a market that is essentially going to put you asleep unless you are a short-term scalper, which then means that you have an excellent market to trade. Back and forth in a range with the ¥107.50 level being a fulcrum for the price is essentially what we are looking at. If you are quick and can babysit the trade, that might be how you choose to approach trading the Japanese yen. To the downside, the ¥106 level has offered a bit of a “double bottom”, which has been extraordinarily strong. If we were to break down below there, that would probably kick off a much bigger move to the downside. To the upside, if we can break above the 200 day EMA, then it opens up the door towards the ¥110 level. Expect more choppiness than anything else.

