One day after the International Monetary Fund (IMF) revised its forecast for the Indian fiscal year 2020 ending in March down from a 2.0% increase to a 4.5% contraction, the National Council of Applied Economic Research (NCAER) published its outlook calling for a 1.3% GDP expansion. It previously forecast a plunge of 12.5% for the same period just a few weeks ago, unless the government implemented massive stimulus programs. Confirming the absence of a complete understanding of how the Covid-19 pandemic will impact India, NCAER also outlined one scenario calling for a 10.0% contraction and one for 0.00% growth. The USD/INR maintains its corrective stance with dominant breakdown pressures.
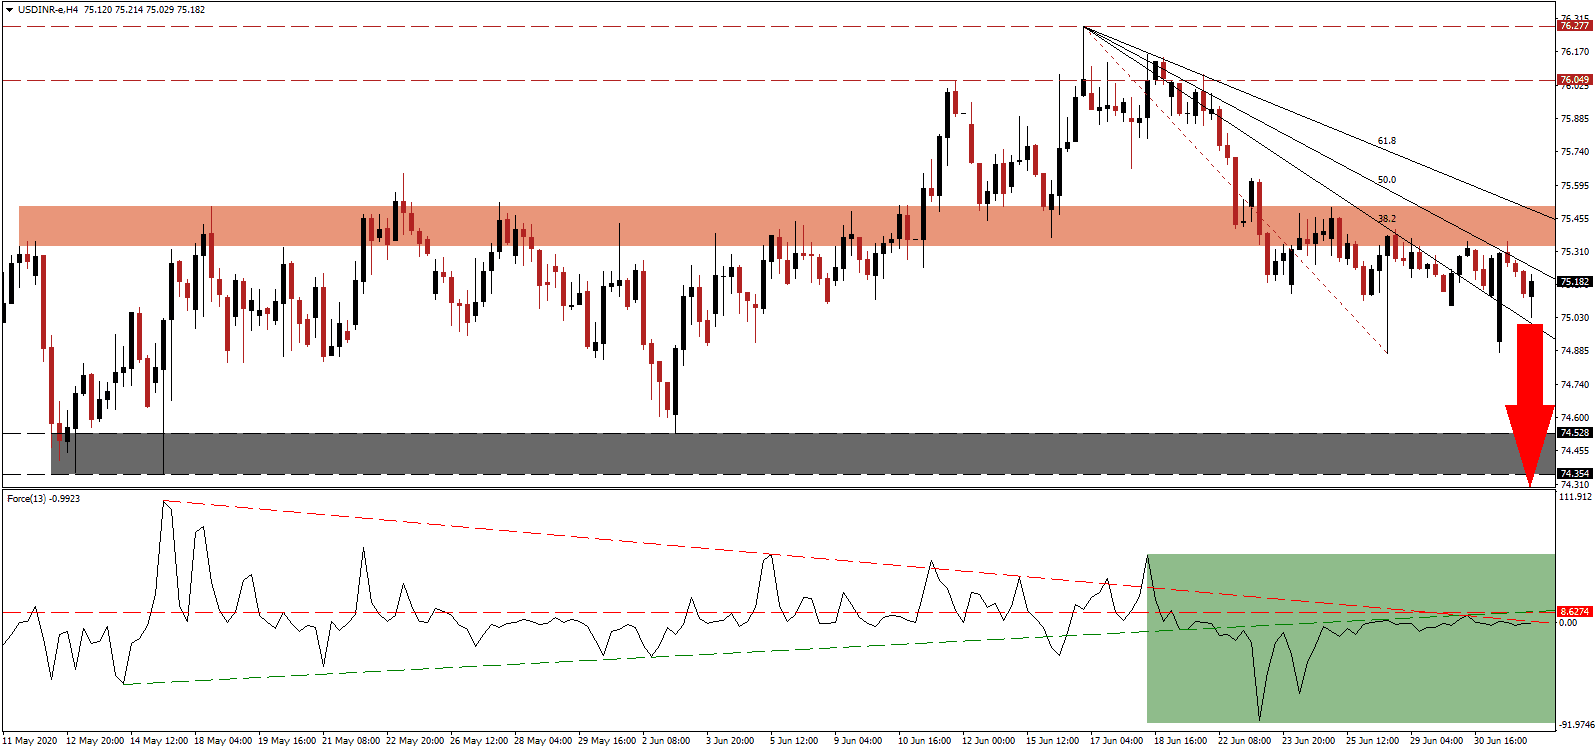
The Force Index, a next-generation technical indicator, remains under intensifying bearish momentum after sliding below its ascending support level. Magnifying downside progress is the descending resistance level, pressuring the Force Index farther below its horizontal resistance level, as marked by the green rectangle. Bears are in control of the USD/INR, with this technical indicator contracting deeper into negative territory.
India’s manufacturing sector accelerated in June, well ahead of expectations, but remains in recessionary territory. It is positioned to expand further as Indian manufacturers sent the government a list of 3,000 items, which can be produced domestically rather than sourced from China. It is in response to the anti-China sentiment after the deadly border clash, leaving 20 troops dead. Following the breakdown in the USD/INR below its short-term resistance zone located between 75.333 and 75.504, as identified by the red rectangle, bearish momentum is favored to drive price action lower.
US data was mixed yesterday, with the labor market flashing warning signs. The ADP report came in below expectations with a minor upward revision for the previous month. While the ISM Manufacturing Index surged above 50.0 to the highest level in 14 months, the employment component disappointed. Construction spending decreased, adding to strains on the economy. The descending 50.0 Fibonacci Retracement Fan Resistance Level is anticipated to force the USD/INR into its support zone located between 74.354 and 74.528, as identified by the grey rectangle. A continuation of the correction into its support zone between 72.695 and 73.303 is probable.
USD/INR Technical Trading Set-Up - Breakdown Extension Scenario
Short Entry @ 75.150
Take Profit @ 72.700
Stop Loss @ 75.600
Downside Potential: 24,500 pips
Upside Risk: 4,500 pips
Risk/Reward Ratio: 5.44
In case the Force Index advances through its descending resistance level, the USD/INR is likely to push for more upside. Forex traders are recommended to consider any price spike from current levels as a secondary selling opportunity, with the US government considering to expand its debt. President Trump supports a higher cash payout in the next round, adding to negative progress in the US Dollar. This currency pair will challenge its next resistance zone between 76.049 and 76.277.
USD/INR Technical Trading Set-Up - Limited Breakout Scenario
Long Entry @ 75.750
Take Profit @ 76.050
Stop Loss @ 75.600
Upside Potential: 3,000 pips
Downside Risk: 1,500 pips
Risk/Reward Ratio: 2.00

