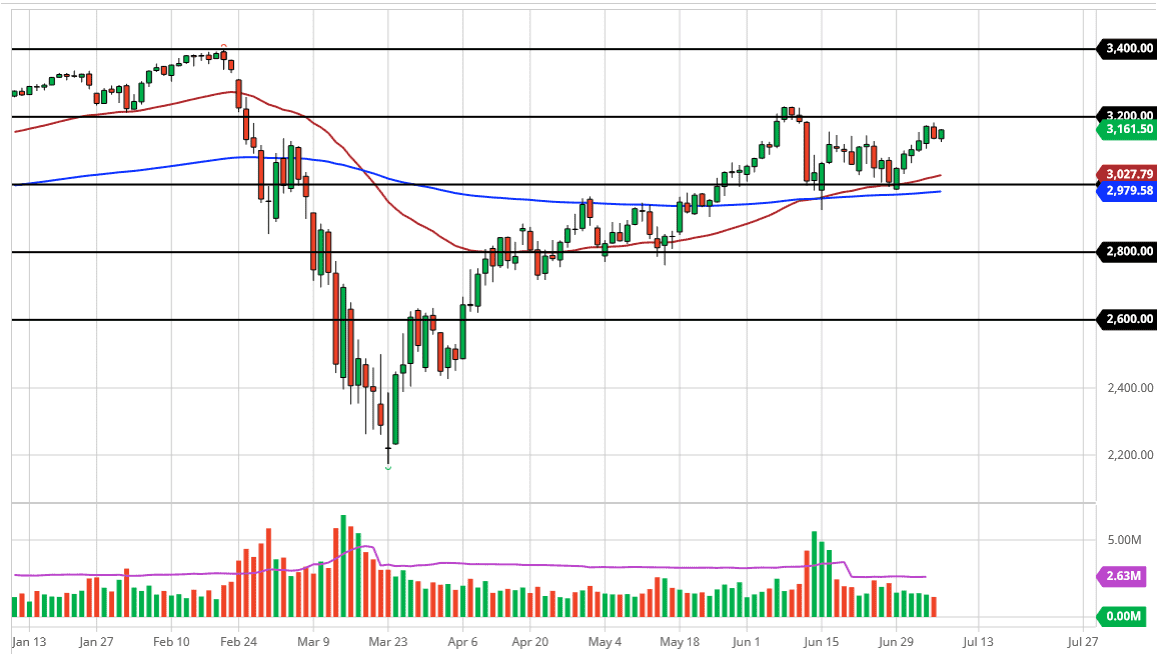
The S&P 500 rallied a bit during the trading session on Wednesday after we initially pulled back. Ultimately, this is a market that still looks as if it is trying to get to the 3200 level so do not be surprised at all if we see some type of surge higher. In the last couple of days, the market is likely to see volatility and as a result, this is a market that is probably thought of more as a short-term trade waiting to happen that anything else.
To the downside, the market breaking down below the 3100 level will open up further selling, perhaps sending down towards the 3000 level. The 3000 level is a crucial barrier and I think is essentially the “floor” in the market. If we were to break down below there, it would not only break down below a large, round, psychologically significant figure, but we also would have sliced through the 50 day EMA and the 200 day EMA. I do not think that happens anytime soon, so quite frankly this is a market that has plenty of buyers underneath to push this market to the upside. If we do break out above the 3200 level, then I think the market is ready to rip to the upside and go looking towards the recent all-time highs. That is what we are destined to do eventually, but short-term pullback should be thought of as value that you can take advantage of.
I have no interest in shorting US stock indices, because they are designed to go higher. In the short term, I think we are simply bouncing around between 3000 and 3200 above. At this point, it is only a matter of time before we break out and the measured 200 point range which is essentially a rectangle measures for a move towards the 3400 level. At this point, I doubt we are going to see a major breakdown, but if we were to break down below the 200 day EMA then it is likely we could go looking towards the 2800 level. That seems to be very unlikely though, so I think we are simply killing time in this area before we can finally choose through the resistance above. Keep in mind that the earnings season starts in about a week, so that could give us the next leg higher or lower.