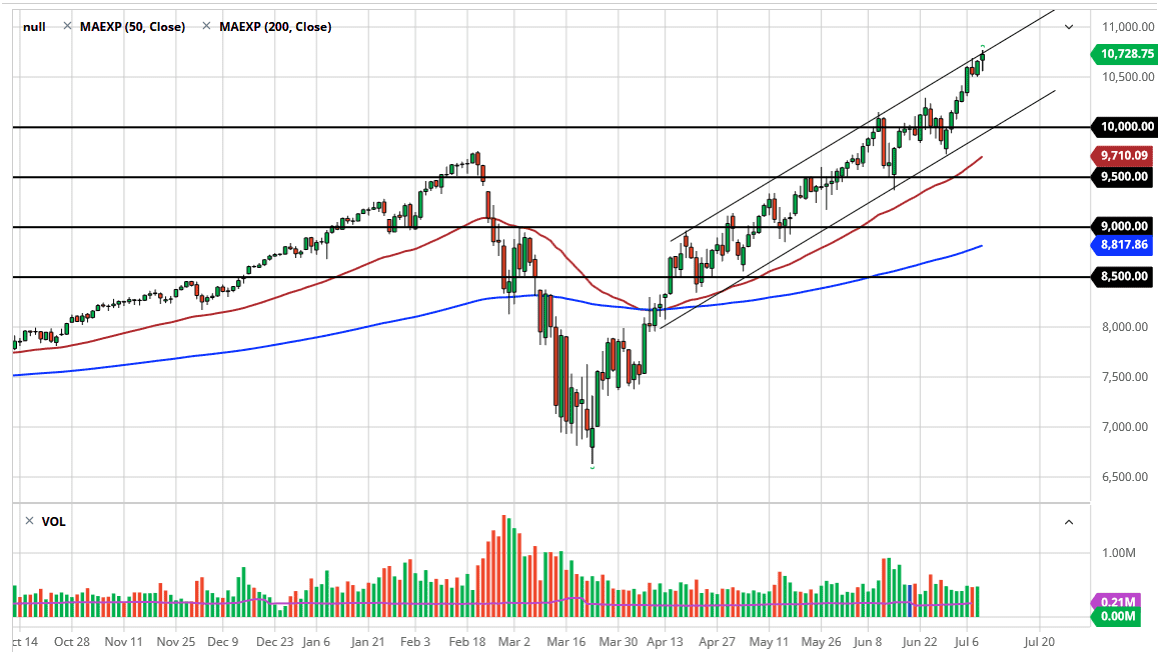
The NASDAQ 100 has had a rough trading session on Thursday, initially breaking down towards the 10,550 level before rallying again to form a bit of a hammer. This hammer sits just at the top of an up trending channel, so the question now is whether or not this market will be able to break out to the upside and blow through the top of this channel, or will it pull back below the 10,500 level? If it does the latter of the two options, and that actually makes the candlestick a “hanging man”, which is an extraordinarily negative sign. At that point, then I think you could probably look for the NASDAQ 100 to break down lower and looking very much like it wants to go down towards the bottom of the channel again. That should be somewhere around the 10,200 level.
Underneath the bottom part of the channel we have the 50 day EMA, and I think that will continue to be especially important. That indicator continues to slice to the upside so therefore the trend is still higher, and of course the well-defined channel is worth paying attention to. If we were to break higher and clear the channel, then we will probably have some type of parabolic move, almost certainly opening up to the 11,000 level. That would be a bit parabolic, and I think the 11,000 level would be a bit difficult for traders to break out above.
To the downside, it is really not until we break down below the 50 day EMA that I would be concerned about the uptrend in general, as we are clearly seen money stuffed into the same old companies again, such as Netflix, Microsoft, Facebook, Alphabet, and Amazon. Furthermore, we also have Tesla and Intel making up another huge chunk of this index, so at this point I wonder whether or not this market is actually going to break down anytime soon. If it does, this index will be the one worth paying attention to because you can take the negativity in this market and pound the Russell 2000 as it will be much more vulnerable. At this point, this is still a market that is a “buy the dips” type of situation, so a pullback is welcomed, it just means you need to step on the sidelines for a couple of days.