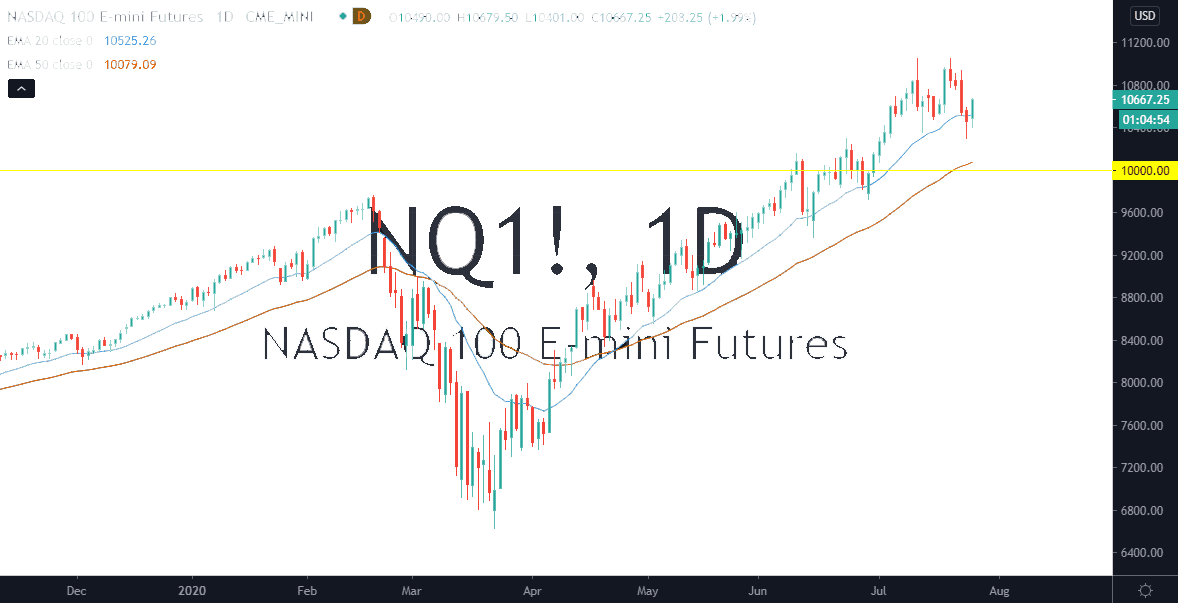
The NASDAQ 100 initially fell during the trading session on Monday but found buyers underneath at the 10,400 level to turn things around and rally again. By breaking above the top of the hammer from the previous session, it suggests that perhaps we are going to go much higher. Ultimately, I think that the highs will be tested again near the 11,000 level. The NASDAQ 100 continues to be heavily influenced by a handful of stocks, a lot of which will continue to be favored by Wall Street in general. This includes Facebook, Microsoft, Apple, Alphabet, and Netflix. Beyond that, you are talking about Tesla and Intel. Those six stocks are roughly 45% of the index. As long as that is going to be the case it is likely that we will continue to find buyers regardless.
Looking at this chart, I think the absolute “floor” in the market is closer to the 10,000 handle, so I believe that we will go looking towards the 11,000 level quicker than not. Short-term pullbacks are buying opportunities, and that will probably be the way you have to trade this market. After all, it is highly dependent on the sample stocks that everybody on Wall Street loves. Once we get through a couple of the earnings announcements, then it is likely that we will see a lot of noise overall. The uptrend is very much intact, and we are trading in a nice up trending channel.
The NASDAQ 100 continues to be more volatile than the S&P 500 and I think that we are looking at this index being a leader. That has been the way for years, and I think continues to be the case. The 50 day EMA is currently crossing the 10,000 level, which is a technical indicator that will continue to attract a lot of attention. The area between the 20 day EMA and the 50 day EMA should offer a “zone of support” that traders will continue to pay attention to. The trend is to the upside, so I do not have any interest in trying to get cute and short this market as it has been so decidedly bullish for so long. We are closing towards the top of the daily candlestick, which suggests that we will almost certainly see some type of follow-through during the next day.