The difference between success and failure in Forex trading is very likely to depend upon which currency pairs you choose to trade each week, and not on the exact trading methods you might use to determine trade entries and exits. The current market environment has changed from one of crisis to a questionable rebound, despite the growth in the global coronavirus pandemic which continues.
Big Picture 12th July 2020
In my previous piece last week, I saw the most attractive trade set-ups as likely to be long of the NASDAQ 100 Index, and Gold in U.S. Dollar terms following a daily (New York) close above $1800. This was a profitable call, as the NASDAQ 100 Index rose by 4.98% over the week. Gold closed at $1809.006 last Wednesday and ended the week down by 0.58% at $1798.446. Therefore, a total profit of 4.40% was achieved just this week.
Last week’s Forex market saw the strongest rise in the relative value of the New Zealand Dollar and the strongest fall in the relative value of the Australian Dollar. However, the relative values were so small as to have little meaning.
Fundamental Analysis & Market Sentiment
The world is not coming to an end, but we are living in an extraordinary time of global health crisis, the type of which has not been seen in one hundred years. There is both fear and optimism, but it is important to remember that the evidence shows that the vast majority of people are going to survive and be healthy.
Friday saw daily new confirmed coronavirus cases hit a new all-time high of 236,918 cases. This is a sign that globally, the wave of disease is still advancing to a peak.
We have seen the epicenter of the global coronavirus pandemic move into Latin America, with Brazil now seeing more new deaths from the virus than any other country in the world, and a higher total death toll than any country except the U.S.A. The rolling averages of deaths have decreased significantly in Europe. However, the U.S.A. has seen a sharp increase in new cases over recent weeks to new all-time highs of over 66,000 cases per day. Cases are also rising in Asia and Africa.
Latin America and the Caribbean are now responsible for approximately 49% of confirmed new daily deaths, with the U.S.A. at about 12% and Europe at about 9%. The strongest growth in new confirmed cases is happening in Brazil, the U.S.A., Albania, Algeria, Argentina, Australia, Bahrain, Bolivia, Bulgaria, Cameroon, Colombia, Costa Rica, Croatia, Ecuador, Ethiopia, El Salvador, Greece, Guatemala, India, Indonesia, Iraq, Israel, Japan, Kenya, Lebanon, Luxembourg, Mexico, Moldova, North Macedonia, Oman, Paraguay, Portugal, Serbia, Sri Lanka, South Africa, Uzbekistan and Venezuela.
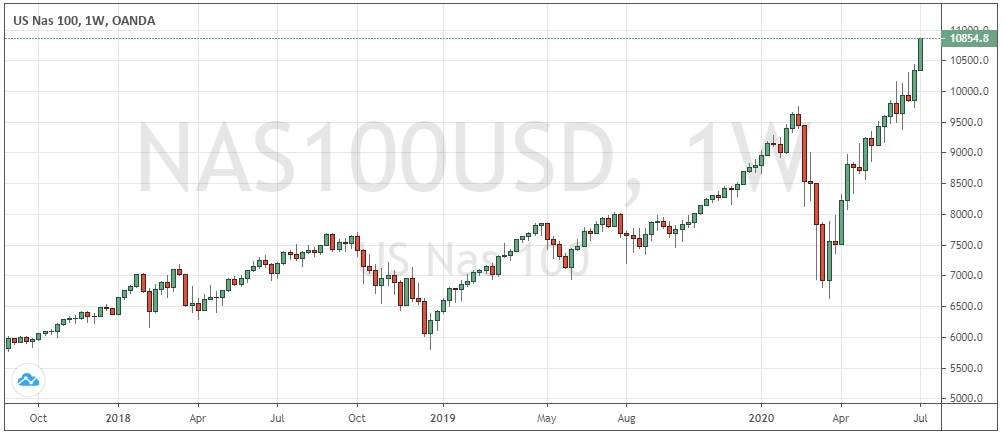
The U.S. stock market rose a little last week but is not breaking strongly to new highs. The sector which has been doing the best by far is technology, with the NASDAQ 100 Index closing the week at a new all-time high, as big tech companies are seen as major gainers from the changes wrought by the coronavirus pandemic.
There is evidence that the coronavirus pandemic in the U.S.A. is peaking to a new crest throughout many states in the south and west. New confirmed daily cases keep rising to hit new all-time daily high totals. There is concern about the persistence of unemployment from earlier closures and restrictions and the economic impact of the reversals of easing which are now being imposed in several states.
There was little important economic data released last week outside Canada and Australia.
Technical Analysis
U.S. Dollar Index
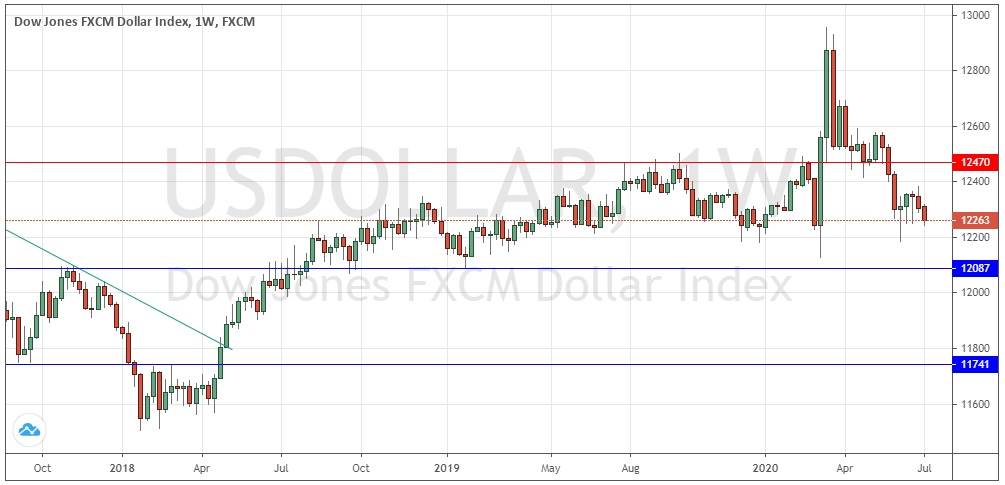
The weekly price chart below shows last week printed another relatively small bearish candlestick which followed another bearish candlestick last week. This short-term price action is unquestionably bearish. There is finally a long-term bearish trend, as the price is lower than it was both 3 and 6 months ago. The problem for bears is that the price is now close to the 12200 area which has provided support since early 2019, so a break below 12087 would be a significantly bearish technical development if it happens. Overall, next week’s price movement in the U.S. Dollar looks slightly more likely to be downwards than upwards based upon the recent price action.
NASDAQ 100 Index
Last week saw this major technology index close, at an all-time high price with a strong bullish move over the week, which closed right at the high of the week’s price range. These are all bullish signs and the chances are that the index will advance again over the coming week. The coronavirus pandemic is boosting major tech companies such as Amazon and Netflix.
Gold
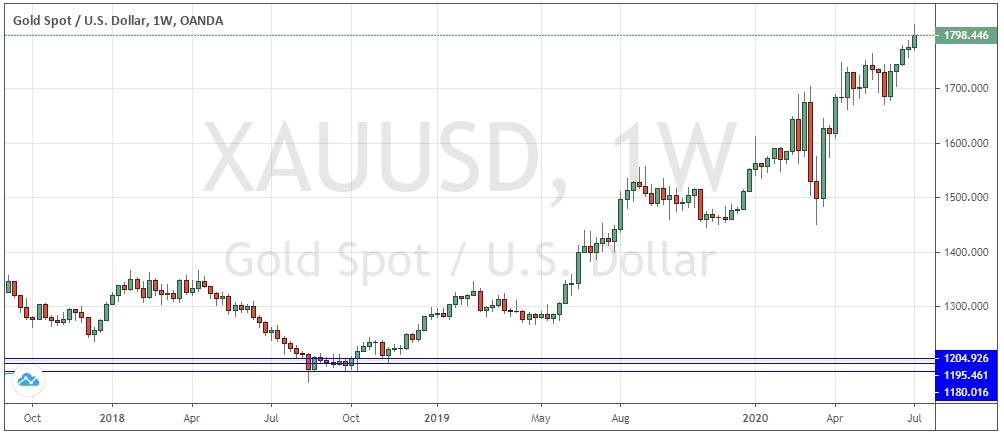
Last week printed a bullish candlestick which closed at a new 8-year high weekly closing price, after hitting a new 8-year high price. However, the price pulled back significantly from the weekly high, so bulls should wait to see a daily close above $1800 before getting involved. I again see that it will be a better time to trade Gold once we get a daily close above the natural nearby resistance level at $1800.
NZD/USD
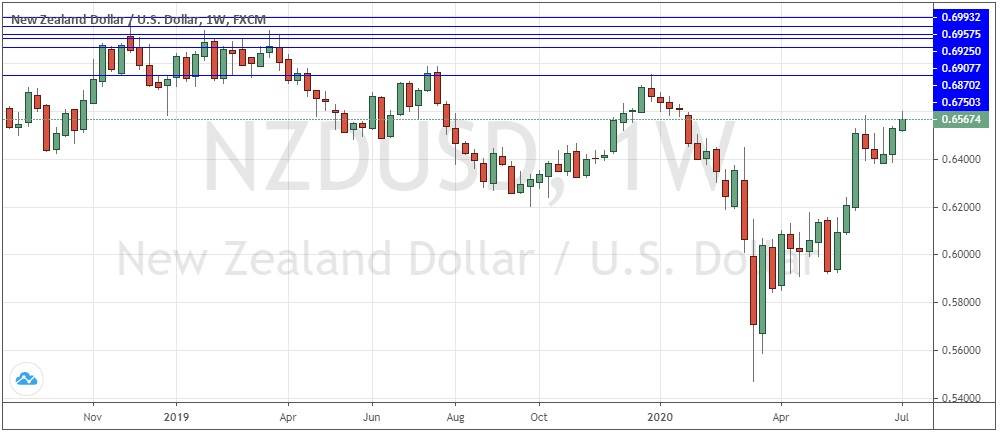
Last week saw a small bullish, as part of a strong 3-month bullish trend which is breaking to new highs. Broadly improving global risk sentiment has helped boost the New Zealand Dollar, as has the near-total suppression of the coronavirus in New Zealand. Meanwhile, the USD seems poised to begin a true long-term downwards trend. However, as the candlestick here was small and weak, there is a lower chance that we will again see higher prices in this Forex currency pair over the coming week.
Bottom Line
I again see the most attractive trade set-ups for this week as likely to be long of the NASDAQ 100 Index, and long of Gold in U.S. Dollar terms following a daily (New York) close above $1800.


