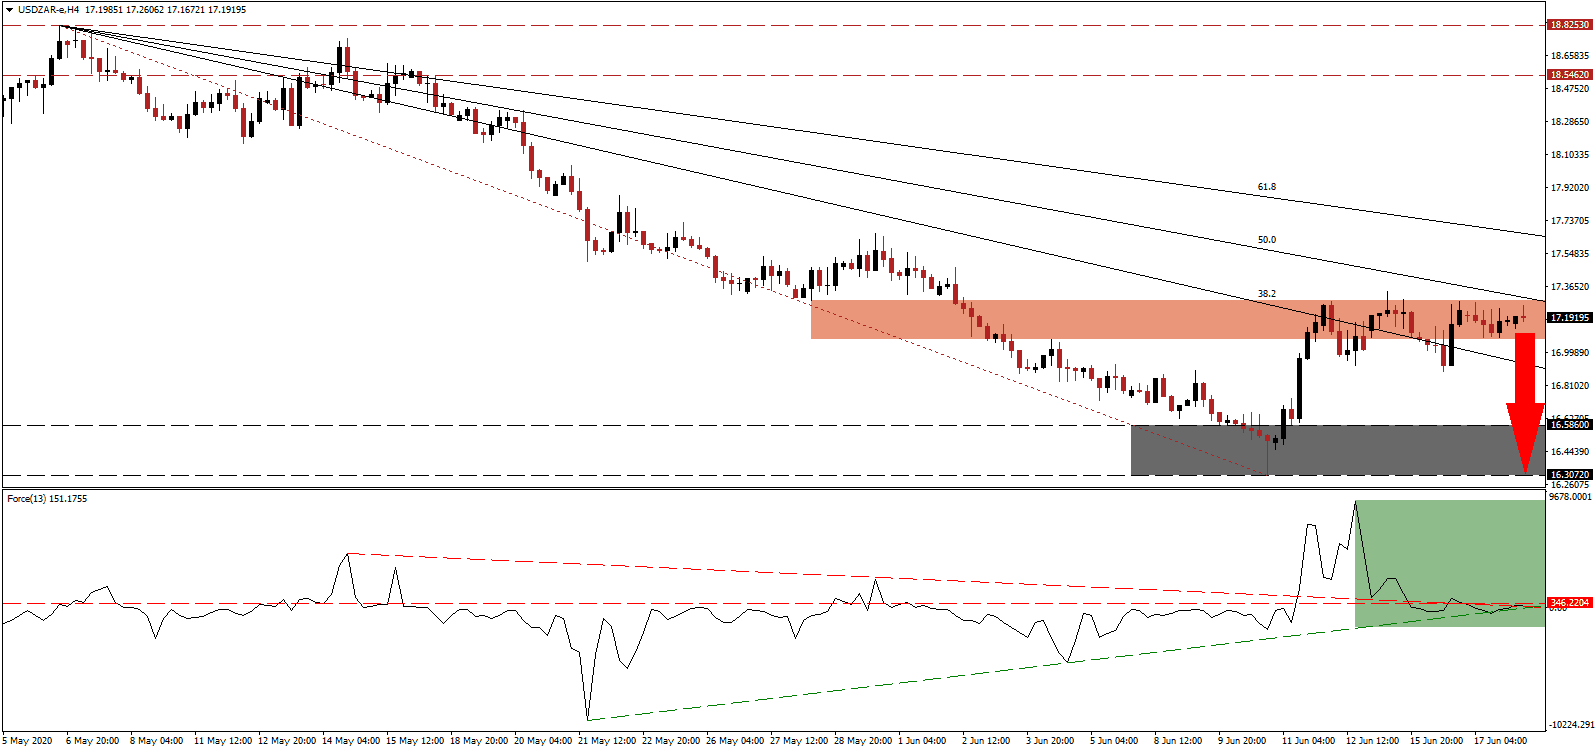
Housing starts and building permits data out of the US disappointed yesterday, recovering less than economists predicted. It adds to a series of disappointments, but the vast majority of financial markets prefer to focus on retail sales. While the surge in May consumer activity was surprisingly strong, in context with April’s record plunge, it loses significance. The spike in new infections since the reopening of the economy, together with a notable increase in hospitalizations, suggests new localized lockdowns cannot be excluded. It adds to breakdown pressures in the USD/ZAR, presently trending sideways inside its resistance zone.
The Force Index, a next-generation technical indicator, swiftly collapsed from a new multi-week peak. It led to a move below its descending resistance level and a conversion of its horizontal support level into resistance, as marked by the green rectangle. The magnitude of bearish momentum is favored to pressure the Force Index below its ascending support level. Bears will resume complete control of the USD/ZAR after this technical indicator moved below the 0 center-line.
Today’s initial jobless claims data out of the US could provide the next short-term catalyst for price action. The NFP report for May showed surprise addition of jobs, after April’s record plunge. While it was cheered, initial jobless claims remain elevated. Economic data suggests it may have been an anomaly as the retail and hospitality sectors added temporary staff to comply with new rules to reopen. It positions the USD/ZAR for a breakdown below its short-term resistance zone located between 17.0717 and 17.2890, as marked by the red rectangle.
South African President Ramaphosa urged the country’s youth to assist in the post-COVID-19 recovery as the economy stalled. Africa’s most industrialized country and the second-largest economy struggled with high unemployment, 29% before the virus resulted in a nationwide lockdown, and is labeled the world’s most unequal country. While the government, past and present, avoided addressing structural issues, the willingness to reform adds a minor bullish catalyst to the South African Rand. The descending 50.0 Fibonacci Retracement Fan Resistance Level is anticipated to initiate a breakdown sequence in the USD/ZAR into its support zone located between 16.3072 and 16.5860, as identified by the grey rectangle, with more downside probable.
USD/ZAR Technical Trading Set-Up - Breakdown Scenario
Short Entry @ 17.2000
Take Profit @ 16.3000
Stop Loss @ 17.4000
Downside Potential: 9,000 pips
Upside Risk: 2,000 pips
Risk/Reward Ratio: 4.50
In case the Force Index pushed above its descending resistance level, the USD/ZAR could attempt a breakout. The US is unprepared for new lockdown measures, and any price spike from current levels will offer Forex traders a second short-selling opportunity. South Africa’s $4.2 billion loan request from the International Monetary Fund’s coronavirus relief facility represents a long-term error, but US negative progress is dominant. The 61.8 Fibonacci Retracement Fan Resistance Level is likely to enforce the bearish chart pattern.
USD/ZAR Technical Trading Set-Up - Limited Breakout Scenario
Long Entry @ 17.4700
Take Profit @ 17.6200
Stop Loss @ 17.4000
Upside Potential: 1,500 pips
Downside Risk: 700 pips
Risk/Reward Ratio: 2.14

