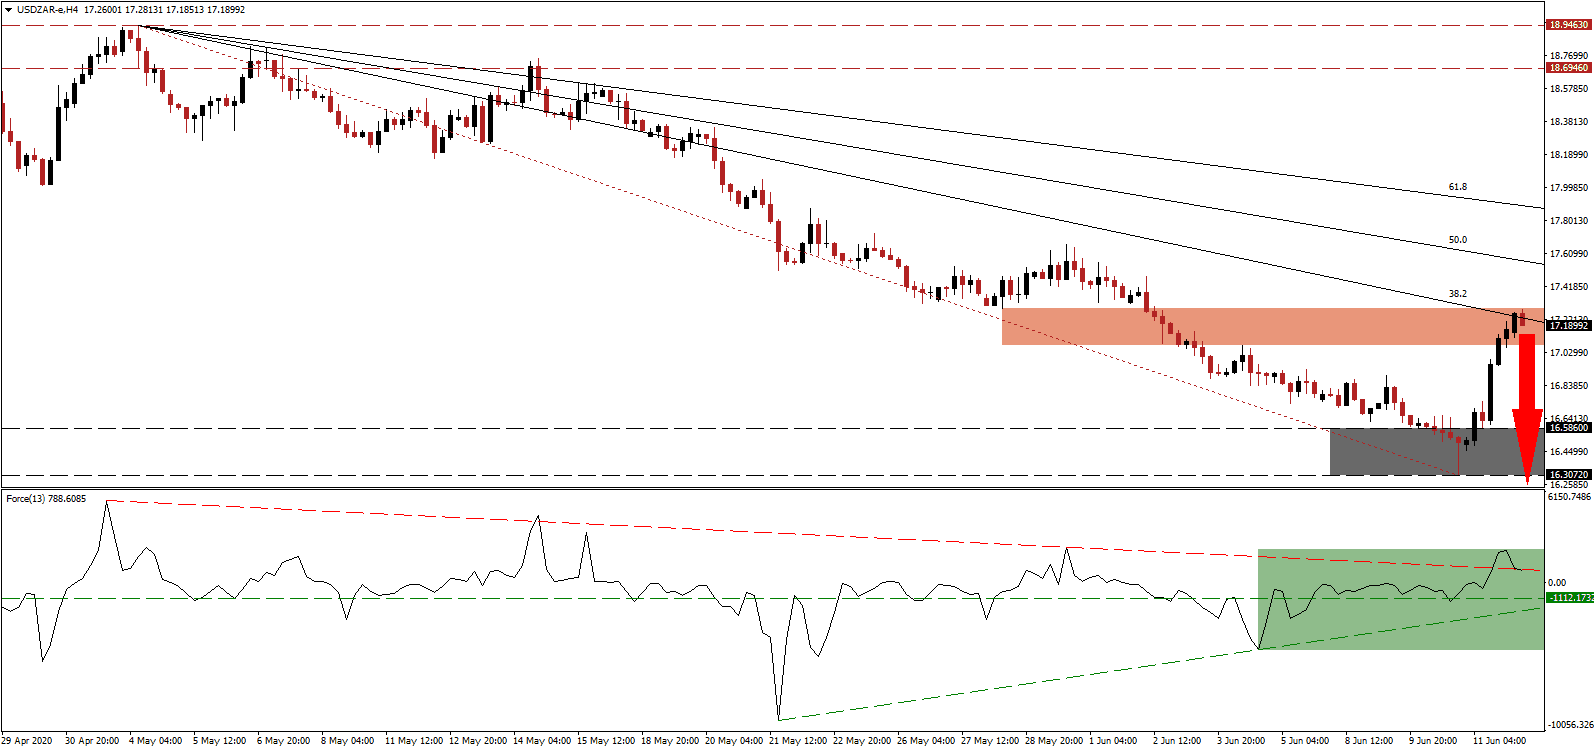
According to the Global Economic Prospects report for June 2020, distributed by the World Bank, the economy will face a 5.2% GDP contraction. South Africa is forecast to underperform with an estimated 7.1% drop in output. It represents a downward revision of 8.0% compared to the preceding assessment and constitutes the worst reading in over 100 years. The International Monetary Fund, in its April review, saw a 5.8% decrease in Africa’s most industrialized economy. The USD/ZAR completed a required counter-trend advance and has now reached its short-term resistance zone, favored to enforce the long-term correction in this currency pair.
The Force Index, a next-generation technical indicator, advanced together with price action, but after a brief spike above its descending resistance level, as marked by the green rectangle, is now reversing those gains. An extension below its horizontal support level is expected to result in a breakdown below its ascending support level. Bears will then wait for this technical indicator to contract below the 0 center-line to regain control of the USD/ZAR.
Reducing misplaced optimism about the fallout from the global Covid-19 pandemic was the outlook for 2021. The World Bank cautioned that a series of positive developments need to occur by the end of July to set the economy on track to a 4.2% recovery next year. It suggests 2022 as the earliest date for a return to pre-crisis levels, but progress around the world points towards a worsening of the situation. Given the US preference of debt and hope, a breakdown in the USD/ZAR below its short-term resistance zone located between 17.0717 and 17.2890, as marked by the red rectangle, is anticipated.
Adding to downside pressures is the descending 38.2 Fibonacci Retracement Fan Resistance Level, which maintains the well-established bearish chart pattern. A breakdown is likely to spark a profit-taking sell-off, providing the required volume to accelerate the USD/ZAR into its support zone located between 16.3072 and 16.5860, as identified by the grey rectangle. A continuation of the correction cannot be excluded, and the next support zone awaits price action between 15.7482 and 16.0010.
USD/ZAR Technical Trading Set-Up - Profit-Taking Scenario
Short Entry @ 17.1700
Take Profit @ 15.7500
Stop Loss @ 17.5700
Downside Potential: 14,200 pips
Upside Risk: 4,000 pips
Risk/Reward Ratio: 3.55
In the event the Force Index uses its descending resistance level to reverse, the USD/ZAR could attempt a breakout. The upside remains confined to its 61.8 Fibonacci Retracement Level, which will offer Forex traders a secondary short-entry opportunity. The outlook for the US economy is increasingly bearish, expanding long-term bearish pressures in this currency pair. South Africa’s willingness to reform adds another catalyst.
USD/ZAR Technical Trading Set-Up - Limited Breakout Scenario
Long Entry @ 17.6700
Take Profit @ 17.8700
Stop Loss @17.5700
Upside Potential: 2,000 pips
Downside Risk: 1,000 pips
Risk/Reward Ratio: 2.00

