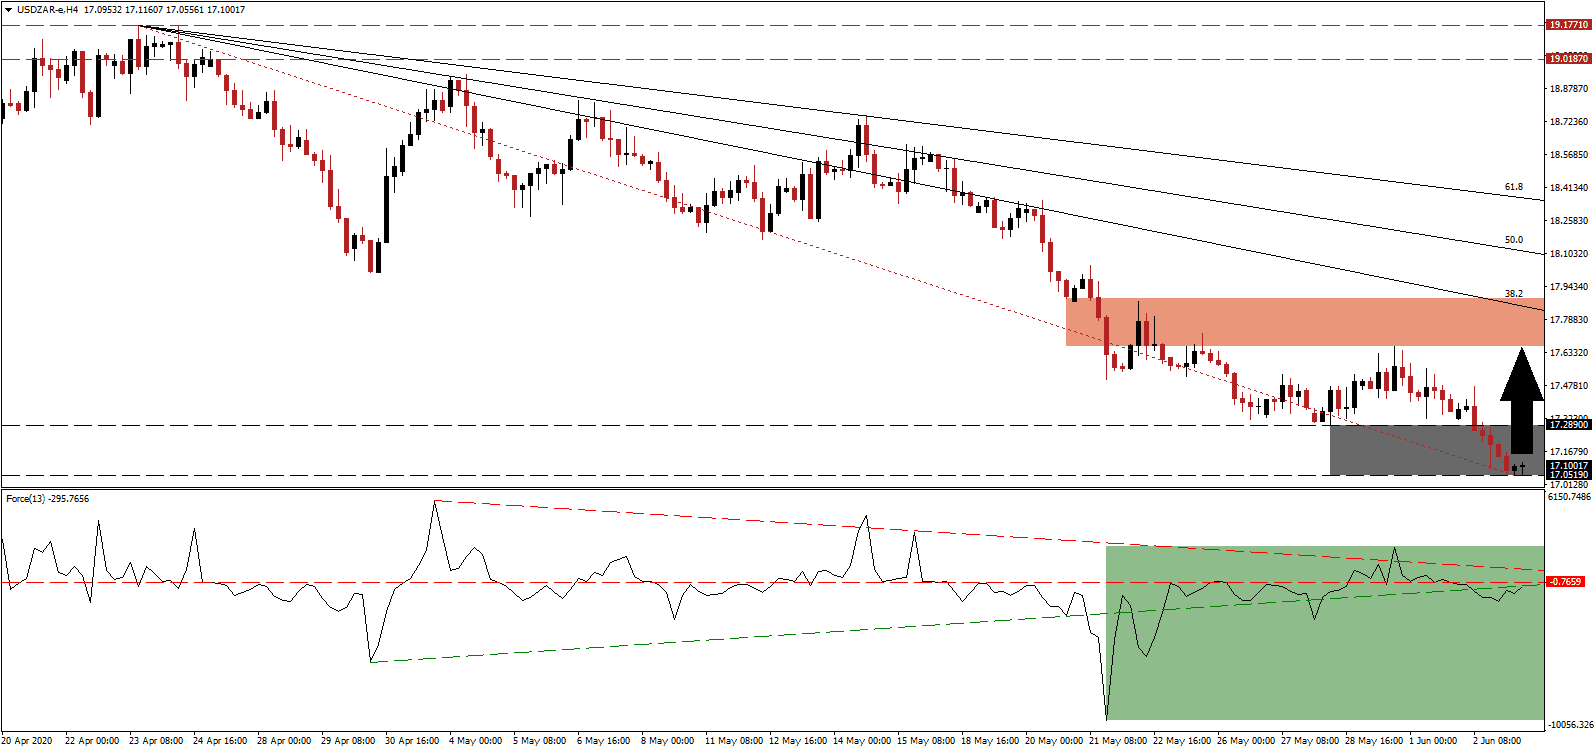
Warnings from the South African Reserve Bank (SARB) regarding acceleration in government debt are echoed across the global financial system. The US is leading the race to fuel a future debt crisis, which is promoted by US President Trump. Given the annualized interest payments above $1trillion to service existing issuance, a number expected to increase, the US requires a zero-interest rate policy to continue borrowing or risk the collapse of its economic model. The devaluation of the US Dollar is a welcome side effect from the US Federal Reserve’s monetary policy, but the economy operates on borrowed time. While the long-term downtrend in the USD/ZAR is intact, another minor price spike out of its support zone is favored to precede an extension of the corrective phase.
The Force Index, a next-generation technical indicator, resumes its drift higher following the recovery off of a new multi-month low. It is now challenging its ascending support level, serving as resistance, as marked by the green rectangle. The Force Index remains below its horizontal resistance level, and the descending resistance level is maintaining downside pressure. Bears are in control of the USD/ZAR with this technical indicator firmly below the 0 center-line.
South Africa has a history of increasing debt. Between 2008 and 2019, the government expanded borrowing by 33% of GDP. While its debt-to-GDP ratio remains well below that of the US, which exceeds 100%, the trend gives reason to question the approach. Public finances are additionally bleeding capital due to the support of state-owned enterprises, which are forecast to require even more cash. Despite widespread issues, the uncontrolled US debt binge supplies long-term downside pressure in the USD/ZAR. A short-term breakout above its support zone located between 17.0519 and 17.2890, as marked by the grey rectangle, will ensure the health and longevity of the bearish trend.
Adding a bright spot for South African debt is that approximately 90% is denominated in the South African Rand, and not exposed to Forex fluctuations. The high maturity rate at an average of thirteen years limits rollover risks and provides the government with a buffer to implement reforms and increase tax revenues. The upside potential for a pending price spike in the USD/ZAR is confined to its downward adjusted short-term resistance zone located between 17.6607 and 17.8880, as identified by the red rectangle. Enforcing the long-term bearish chart pattern is the descending 38.2 Fibonacci Retracement Fan Resistance Level.
USD/ZAR Technical Trading Set-Up - Temporary Breakout Scenario
Long Entry @ 17.1000
Take Profit @ 17.6500
Stop Loss @ 16.9000
Upside Potential: 5,500 pips
Downside Risk: 2,000 pips
Risk/Reward Ratio: 2.75
Should the ascending support level reject the Force Index, the USD/ZAR is anticipated to resume its long-term trend without interruption. Minor counter-trend price spikes are necessary to ensure the stability of the trend. Forex traders are recommended to sell any rallies, as the bearish outlook remains dominant. The next support zone is located between 16.0010 and 16.2707, while more downside is favored to materialize.
USD/ZAR Technical Trading Set-Up - Breakdown Extension Scenario
Short Entry @ 16.7200
Take Profit @ 16.0200
Stop Loss @ 16.9000
Downside Potential: 7,000 pips
Upside Risk: 1,800 pips
Risk/Reward Ratio: 3.89

