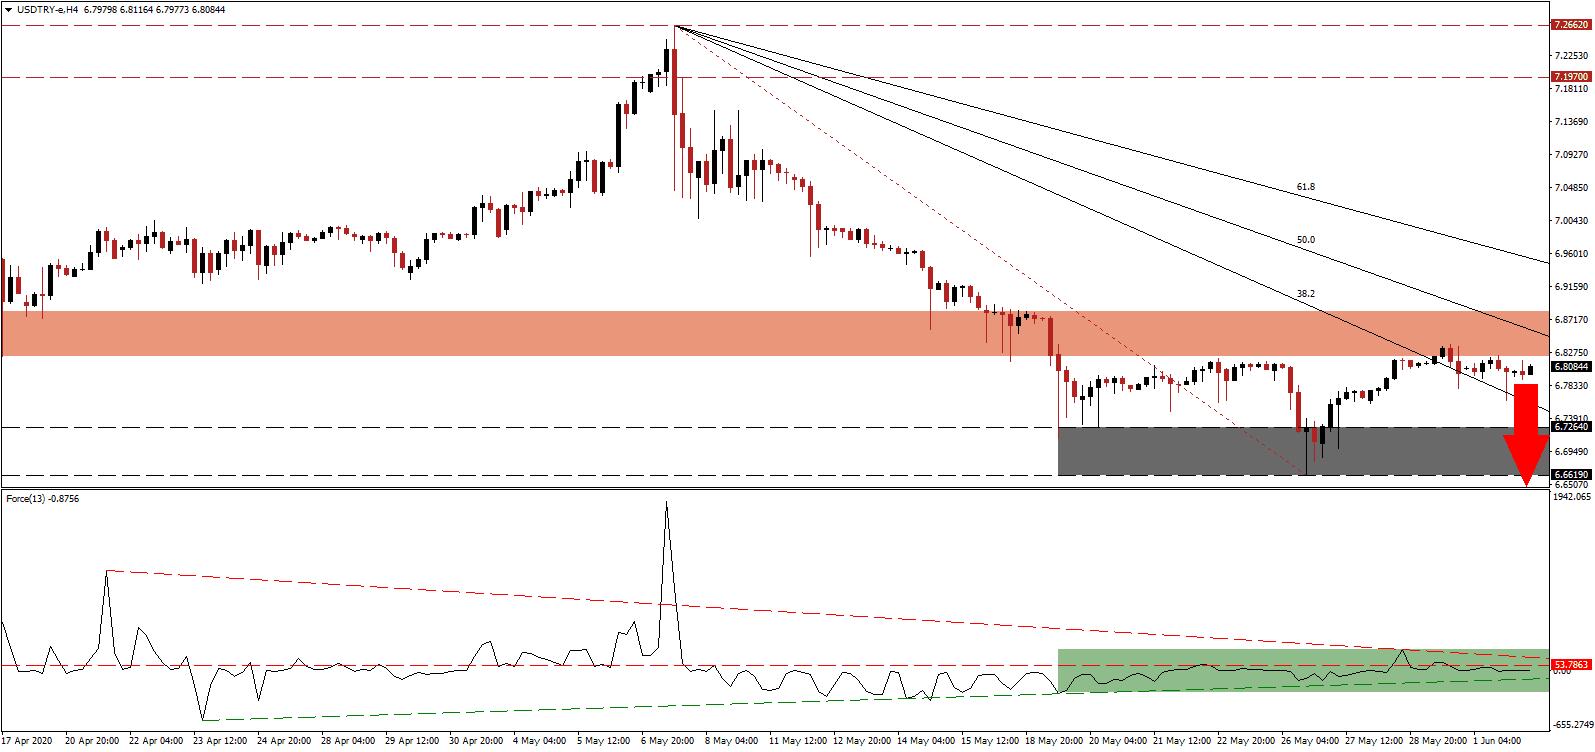
Turkey produced the most significant first-quarter GDP data compared against the EU, G20, and OECD members, with a 4.5% annualized growth rate. While the country is faced with identical economic problems as its peers, related to the global Covid-19 pandemic, it entered the lockdown with an accelerating economy. Treasury and Finance Minister Berat Albayrak added that leading indicators suggest the country is past the low-point of the crisis and on a path to recovery. He predicts Turkey will close 2020 with positive growth, defying calls for an extended recession. The USD/TRY pushed out of its support zone in a count-trend advance, which was not backed by bullish momentum and favored to reverse.
The Force Index, a next-generation technical indicator, points towards the dominance of bearish momentum. It entered a sideways trend below its horizontal resistance level after price action reached its support zone, as marked by the green rectangle. The descending resistance level is anticipated to pressure the Force Index below its ascending support level. Once this technical indicator collapsed below the 0 center-line, bears will be in charge of the USD/TRY.
Ziraat, Halkbank, and Vakifbank, the three largest Turkish state-owned banks, announced four loan packages to support credit demand from businesses and consumers to spur domestic demand. The total stimulus Turkey announced totals ₺600 billion or approximately 10% of GDP. After the USD/TRY briefly advanced into its short-term resistance zone located between 6.8216 and 6.8822, as marked by the red rectangle, it was swiftly rejected. The descending Fibonacci Retracement Fan sequence is enforcing the established bearish trend in this currency pair.
Increasing the recovery potential of Turkey’s domestic economy is the vast amount of gold reserves stashed in households, forecast to range between $200 and $300 billion, or an estimated 25% to 33% of GDP. It counters the $50 billion of currency reserve selling to support the Turkish Lira so far in 2020 and compares to $77 billion of selling at the start of 2019. The USD/TRY is well-positioned to collapse below its support zone located between 6.6619 and 6.7264, as identified by the grey rectangle. A breakdown extension into its next support zone between 6.3739 and 6.4454 is expected to materialize.
USD/TRY Technical Trading Set-Up - Breakdown Scenario
Short Entry @ 6.8050
Take Profit @ 6.3750
Stop Loss @ 6.9050
Downside Potential: 4,300 pips
Upside Risk: 1,000 pips
Risk/Reward Ratio: 4.30
In case the Force Index spikes above its descending resistance level, the USD/TRY could attempt a second breakout. The 61.8 Fibonacci Retracement Fan Resistance Level provides a significant level to monitor, favored to enforce the downtrend, while the next resistance zone is located between 7.1970 and 7.2662. Forex traders are recommended to consider any advance from current levels as an outstanding selling opportunity, backed by a bullish economic outlook on the Turkish economy.
USD/TRY Technical Trading Set-Up - Limited Breakout Scenario
Long Entry @ 7.0500
Take Profit @ 7.2500
Stop Loss @ 6.9500
Upside Potential: 2,000 pips
Downside Risk: 1,000 pips
Risk/Reward Ratio: 2.00

